
TQQQ promises three times the daily performance of the Nasdaq-100, before fees and expenses. The word “daily” determines how the fund behaves. It does not promise three times your return over a month, a year or an investment lifetime.
This English adaptation of Y-bow’s Japanese guide focuses on the mechanics that matter wherever you live: daily resetting, compounding, financing and drawdowns. Access, taxation and investor protections depend on your country. None of the examples is a forecast or a recommendation to buy.
What TQQQ actually targets
ProShares UltraPro QQQ, ticker TQQQ, is a leveraged exchange-traded fund. Its benchmark is the Nasdaq-100, which contains large non-financial companies listed on Nasdaq. It is not the Nasdaq Composite, and it is not a diversified substitute for the whole world stock market. Derivatives help the fund pursue its daily exposure. Read the issuer’s product description and the summary prospectus together.
A 1% benchmark rise on a given day corresponds to a target of approximately 3% for that day, before expenses. A 1% fall corresponds to approximately −3%. Actual fund returns may differ because of expenses, implementation and market conditions. Your trading return also depends on the price you pay, bid–ask spreads and any currency conversion.
A flat index can still produce a loss
Imagine an index starting at 100. It rises 10% to 110, then falls 9.0909%, returning to 100. A hypothetical daily 3× portfolio moves from 100 to 130, then to 94.55. The index is flat across the two days; the leveraged portfolio has lost about 5.45%.
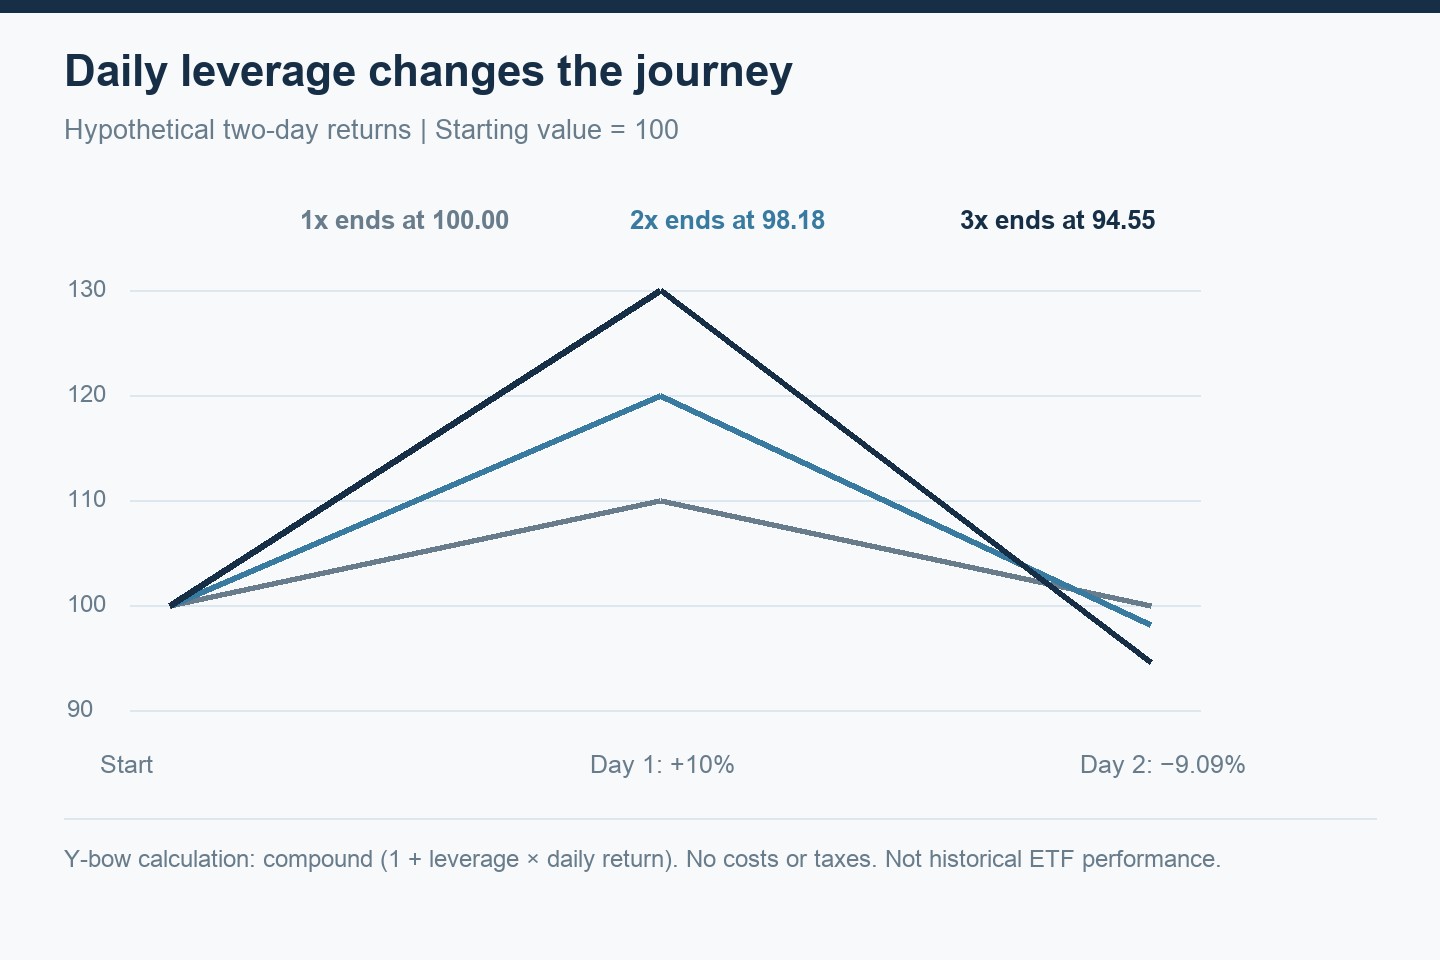
The calculation is simply: next value = previous value × (1 + leverage × daily index return). It shows why a long-period return cannot be obtained by multiplying the index’s long-period return by three.
Compounding can also help
“Volatility drag” is often interpreted as a guarantee of decay. That is too simplistic. Two consecutive 5% index gains produce a 10.25% total index return. A daily 3× portfolio earns two 15% gains, finishing 32.25% higher. That exceeds three times 10.25%, or 30.75%. Direction and the sequence of daily returns matter.
Our interpretation is that TQQQ combines a concentrated equity exposure with a path-dependent amplifier. A strong, persistent trend can reward it; a rough journey can undermine it even when the destination looks attractive. “Technology will grow” alone does not resolve the path risk.
Fees are only part of the cost
The summary prospectus dated September 28, 2026 lists gross annual operating expenses of 0.94% and expenses after the stated waiver of 0.78%, with the waiver agreement running through September 30, 2027. The product webpage showed different figures when checked on October 11, 2026. Use the dated prospectus to understand the applicable disclosure, and check for subsequent filings before acting.
Financing and transaction costs can affect performance beyond the headline operating expense ratio. Higher interest rates may make leverage more expensive. A model that assumes “index return × 3 minus one annual fee” misses both financing and the daily return path.
The recovery problem
A 50% loss requires a 100% gain to return to the starting value. A 70% loss requires approximately 233%; a 90% loss requires 900%. This is arithmetic, not evidence that recovery will occur. Leveraged exposure makes survival, liquidity and the ability to hold a position central questions.
Before considering such a fund, define its role, position size, monitoring process and the losses you can absorb without selling essential assets. Borrowing money to buy a leveraged fund adds another layer of risk. The SEC’s leveraged and inverse ETF investor alert explains why daily objectives deserve particular attention.
Read the return mathematics first
Our guide to CAGR and average returns explains why percentage gains and losses are not symmetrical. The dollar-cost averaging example shows why buying more after a fall does not eliminate losses. For the underlying technology thesis, read our semiconductor supercycle analysis.
Educational analysis; no personalized investment advice. Calculations by Y-bow. Source documents checked October 11, 2026. Japanese counterpart.
Comments
List of comments (1)
[…] ortfolio can be simple and concentrated, or complex and concentrated. Simplicity is useful because it makes the concentration easier to see. Compare this with TQQQ’s concentrated leveraged exposure and our discussion of market valuation indicators. […]