
A large monthly distribution is easy to notice. A changing investment value is easier to overlook. Covered-call ETFs can produce regular cash payments while their total returns differ substantially from those cash payout rates. Understanding the distinction is more useful than declaring all such funds either excellent income machines or inherently bad investments.
QYLD and XYLD are US-listed products. Access, taxes and available share classes differ across countries. A similar name or ticker in another market does not establish that the fund has identical legal terms or distribution treatment.
What the call changes
The issuer describes QYLD as a Nasdaq-100 covered-call strategy and XYLD as an S&P 500 covered-call strategy. They hold equity exposure and sell call options. Selling a call earns a premium while giving up some upside under the option’s terms. The premium offers a limited buffer; it does not remove equity downside.
The exact benchmark, option implementation, expenses and distribution policy matter. Our example below describes a simplified payoff, not either fund’s current holdings or a promise of its performance.
A small payoff experiment
Imagine owning an asset worth 100 and selling a call with strike 100 for a premium of 3. At expiration, ignoring all costs, a final asset price of 80 leaves combined wealth of 83: a 17% loss. At 100, wealth is 103: a 3% gain. At 120, the call offsets the gain above the strike, so combined wealth is still 103.
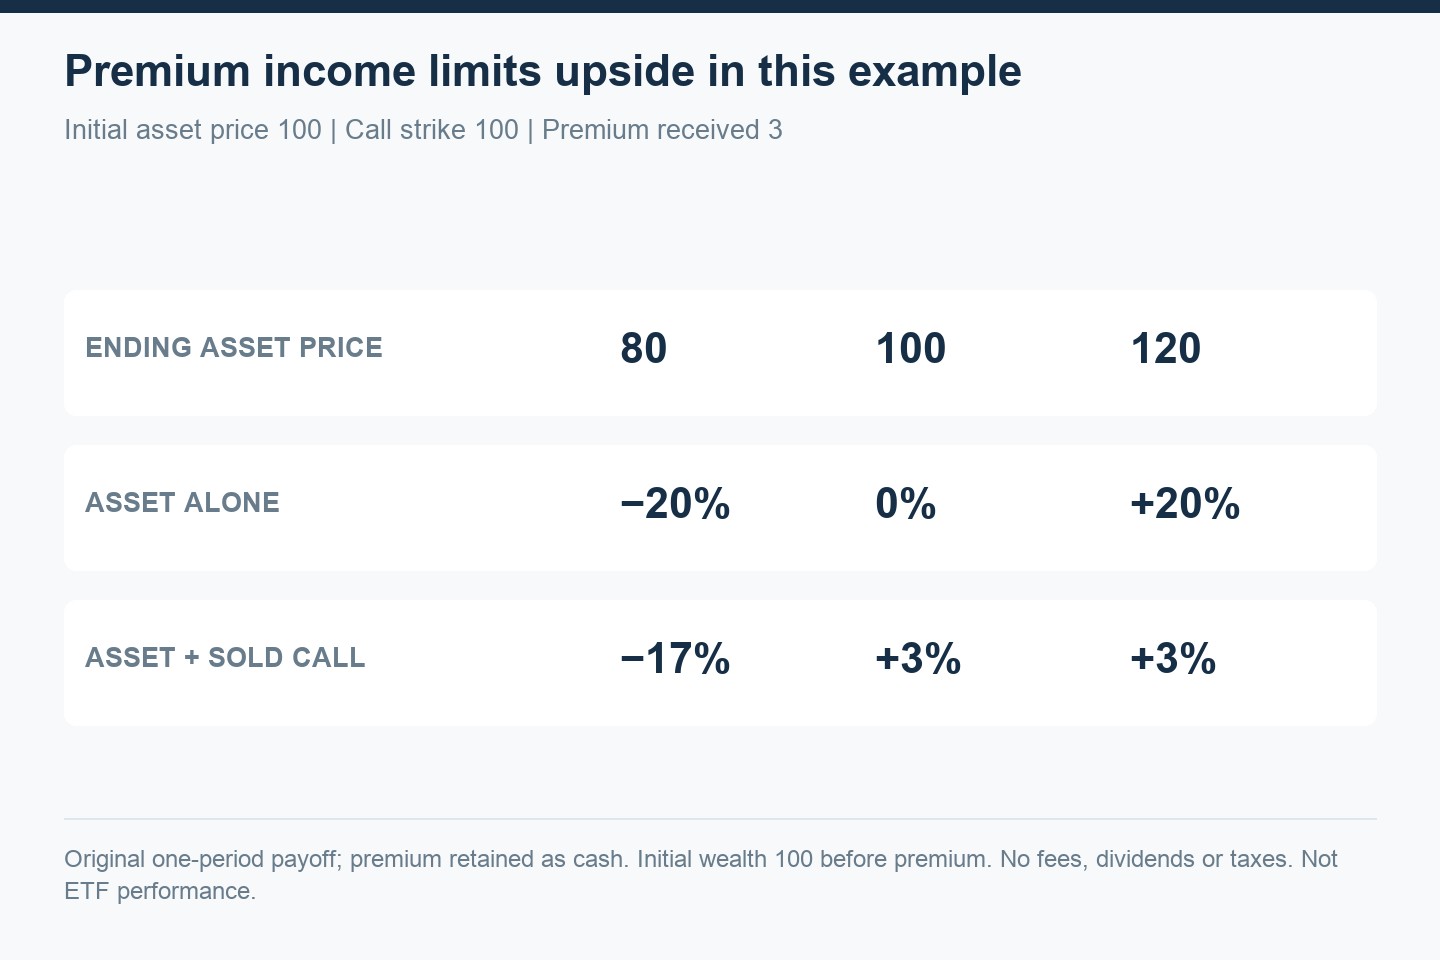
This model assumes one fully covered call, cash-settled payoff arithmetic and no dividend, tax or trading expense. It shows a trade-off. The premium helps in the first case, but a strong rally rewards the uncapped asset much more in the third. Real funds roll options repeatedly, so this single-period illustration cannot predict a year of fund returns.
Follow the money after a payout
Suppose you invest 100, receive a distribution of 10 and finish with shares worth 85. With the cash retained and ignoring timing, your wealth is 95 and your holding-period total return is −5%. The payout was 10% of the initial investment, but your profit was not 10%.
If distributions are reinvested, calculate the final value of all the resulting units. If they are spent, count the cash received when evaluating historical total return, then recognize that it is no longer available to support future spending. Comparing an unreinvested price chart with a reinvested total-return chart mixes different definitions.
Return of capital needs context
Issuer distribution notices may estimate a return-of-capital component. A tax classification is not, on its own, a complete economic diagnosis. Preliminary notices can differ from final tax reporting, and local tax consequences vary. Read the applicable notices and country-specific guidance instead of importing a US tax conclusion unchanged.
Ask whether the fund’s long-term total return, changing capital value and cash-flow pattern fit your objective. A distribution rate is neither a guaranteed future payment nor a guaranteed rate of wealth growth.
Our interpretation
Covered-call income exchanges part of an equity payoff for current option premium. That can be useful for some objectives and costly for others. Evaluate it against a consistent benchmark, after relevant expenses and with a realistic plan for the cash received.
For percentage arithmetic, see CAGR versus average returns. For portfolio concentration, read diversification by risk. No example here recommends buying or selling a fund.
Adapted for the English edition; sources checked October 11, 2026. Original calculations and diagrams by Y-bow. Japanese counterpart.
Comments