
Owning many investments is not the same as spreading your risks. Three technology funds can hold similar companies, depend on the same valuations and react to the same interest-rate shock. The labels look different; the economic exposure may be remarkably similar.
Diversification becomes easier to evaluate when you start with what can hurt the portfolio. A company-specific failure, a broad equity decline, a currency move and an urgent need for cash are different problems. No single fund solves all of them.
Asset class, sector and portfolio
An asset class groups investments with related economic features, such as equities, bonds or cash. A sector groups businesses by their activities. A portfolio is the collection you actually own, including weights and any leverage. A broad stock fund can diversify across companies while remaining exposed to the stock market as a whole.
The SEC’s asset allocation and diversification guide links allocation to goals, time horizon and risk tolerance. It also explains rebalancing. Diversification can reduce some risks, but it does not guarantee profit or prevent a market-wide loss.
Why correlation matters
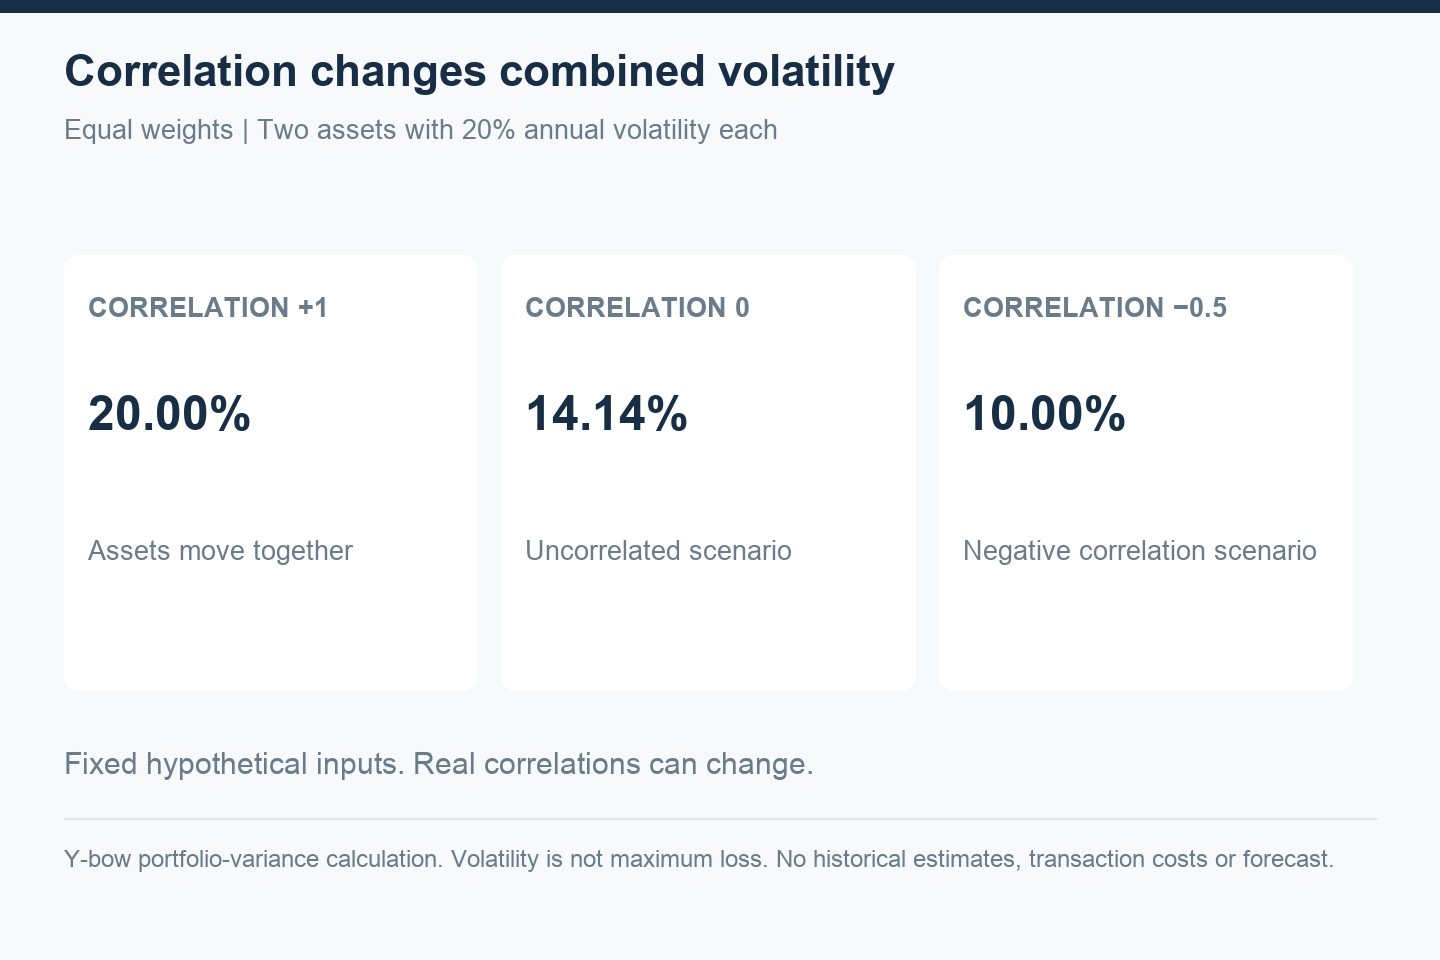
Consider two hypothetical assets, each with annual volatility of 20%, held in equal weights. With correlation 1, their combined volatility remains 20%. At correlation 0 it is approximately 14.14%. At correlation −0.5 it is 10%. These are mathematical scenarios, not estimated forecasts for any ETF pair.
The calculation uses portfolio variance: wA²σA² + wB²σB² + 2wAwBσAσBρ. The square root gives volatility. It assumes fixed inputs and describes variation around an average, not the maximum possible loss.
Real-world correlations can change, particularly during stress. Historical estimates depend on the data window, return frequency and currency. A lower volatility calculation should never be translated into “this combination cannot crash.”
Look through the fund names
Check the largest holdings, sector weights, geographical exposure and underlying indexes. If you own a global equity fund plus a US equity fund, you may be increasing US exposure rather than adding a new independent source of returns. Our VT, VTI and VOO overlap guide makes that distinction concrete.
The same logic applies to leveraged positions. A small allocation to a 3× daily fund can contribute much more exposure than its cash weight suggests. Multiplying weights by stated daily leverage is only a starting approximation; compounding, derivatives and changing market conditions add complexity.
Rebalancing changes the decision
Suppose two assets begin at 50 each. One rises 40% to 70 and the other stays at 50. The first now represents 58.33% of the 120 total. Rebalancing to equal weights would move 10 from the first asset to the second, before costs and taxes.
That is an allocation rule, not proof that the second asset will outperform next. A rule can make risk management more consistent while still producing disappointing returns. Decide how you will treat transaction costs, taxable gains and new contributions before using it.
A portfolio should serve a purpose
We prefer to describe diversification by exposures and failure modes rather than by the number of ticker symbols. Separate near-term liquidity from long-term market exposure. Know which risks remain and whether you can absorb them without changing essential spending.
A sound-looking historical combination can still be the product of hindsight. Read our backtesting guide before turning a chart into a portfolio plan. This article explains concepts, not an allocation recommendation.
Adapted for the English edition; sources checked October 11, 2026. Original calculations and diagrams by Y-bow. Japanese counterpart.

Comments