
AI can create durable growth in demand for computing while semiconductor businesses still experience cycles. These statements are compatible. The more useful question is which part of the industry is constrained, who captures the value and what investors have already paid for that expectation.
This English adaptation develops Y-bow’s central view: distinguish structural demand growth from the cycle in prices, capacity and profits. A “supercycle” should be a thesis with observable conditions, not a promise that every chip stock will rise until a particular year.
Demand for computation is not one market
Accelerators, high-bandwidth memory, conventional DRAM, NAND storage, networking and packaging have different capacity constraints and competitive structures. A shortage in one segment need not create the same pricing power in another. Consumers can also change hardware, software and model architectures as relative costs change.
Inference adds another distinction: the installed base of useful AI services may drive recurring computational work beyond a single training run. Yet technical efficiency can reduce computation per task. Whether total demand grows depends on the balance between lower cost, wider usage and the value people obtain—not efficiency alone.
Energy provides a useful reality check
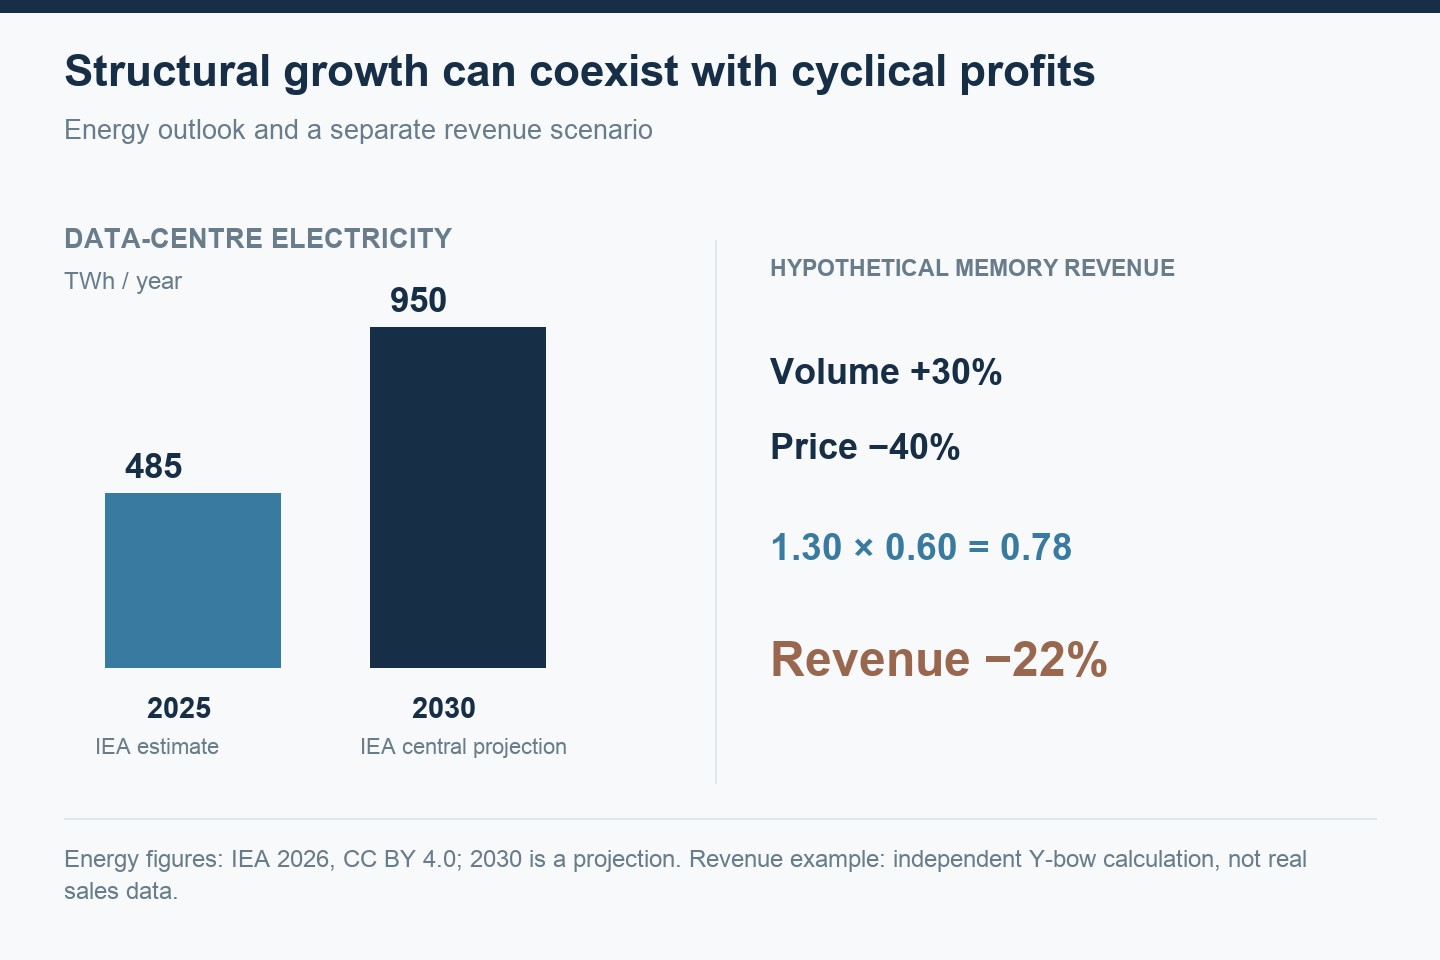
The IEA’s 2026 analysis estimates global data-centre electricity demand at about 485 TWh in 2025 and projects roughly 950 TWh in 2030 in its central outlook. That is a projection, not an observed 2030 outcome, and electricity use is not a direct measure of chip shipments or semiconductor revenue.
The outlook supports taking physical infrastructure seriously. Power availability, grid connections and construction times can constrain deployment even when demand for AI applications is strong. A spending announcement is not the same as energized capacity.
Memory revenue can grow for different reasons
Revenue equals quantity times price. A rise can reflect more units, higher prices, a richer product mix, or all three. TrendForce’s May 29, 2026 forecast revision illustrates how quickly memory revenue expectations can change. Forecasts should remain labeled as forecasts, rather than becoming retrospective proof of an inevitable boom.
Our hypothetical example deliberately goes the other way: unit volume rises 30% while average price falls 40%. Revenue becomes 1.3 × 0.6 = 0.78 of its starting level, a 22% decline. More useful computation and more physical shipments can coexist with falling revenue.
What could prolong the upcycle?
A sustained mismatch between specialized demand and usable supply could preserve pricing power. Complex manufacturing, packaging bottlenecks and customer qualification can delay effective capacity. Product transitions may also make headline wafer capacity a poor description of immediately usable output.
Those mechanisms need evidence. A thesis should identify the constrained product, the expected capacity response, customer commitments and cash conversion. Strong balance sheets may help suppliers invest through a downturn, but do not prevent a downturn or guarantee shareholder returns.
What could change the thesis?
Watch for an increasing gap between announced spending and actual utilization; improving supply alongside shorter lead times; customer inventory accumulation; and weaker pricing despite rising shipments. Also examine whether AI services generate enough value to fund continued infrastructure spending.
These are diagnostic questions, not a fixed checklist that predicts a peak. Several signals can conflict. A shortage may ease because supply catches up, because demand weakens, or because a product transition shifts the bottleneck elsewhere.
A good business can be an expensive investment
Investment return depends on future cash flows relative to the price paid. If a stock already discounts very strong growth, an excellent operating result can still disappoint the valuation. Industry success and stock-market success should therefore be analyzed separately.
We regard the strongest supercycle argument as conditional: useful AI adoption sustains demand, infrastructure becomes available, and some suppliers retain attractive economics as capacity expands. Each condition can be tested and revised. It is more informative than assigning a guaranteed end date.
Our valuation-indicator guide explores why expensive markets are difficult to time. The ETF overlap analysis explains how a seemingly diversified portfolio can concentrate exposure, and TQQQ’s daily leverage adds another layer of path risk.
Independent educational analysis by Y-bow, not a stock recommendation. Original calculations and source checks: October 11, 2026. Japanese counterpart.



Comments