
A portfolio backtest asks what a specified rule would have produced under a particular historical dataset. It does not tell you what the same rule will earn next year. That distinction sounds obvious until a smooth rising chart begins to feel like a plan.
We use backtests to examine assumptions, expose difficult periods and compare consistent alternatives. A test becomes less useful when its start date, asset choices and decision rules are quietly adjusted until the result looks impressive.
Start with the question
Are you testing a lump sum, contributions from future pay, or withdrawals for living expenses? These are different questions. Portfolio Visualizer’s backtest tool supports comparisons of portfolios, cash flows and rebalancing assumptions. Its own disclosure states that hypothetical results are not guarantees. Consult the documentation and current plan limits rather than relying on an old screenshot of the interface.
A tool is a calculator with data and conventions. It cannot decide which assumptions are appropriate for your household.
Cash-flow timing changes the outcome
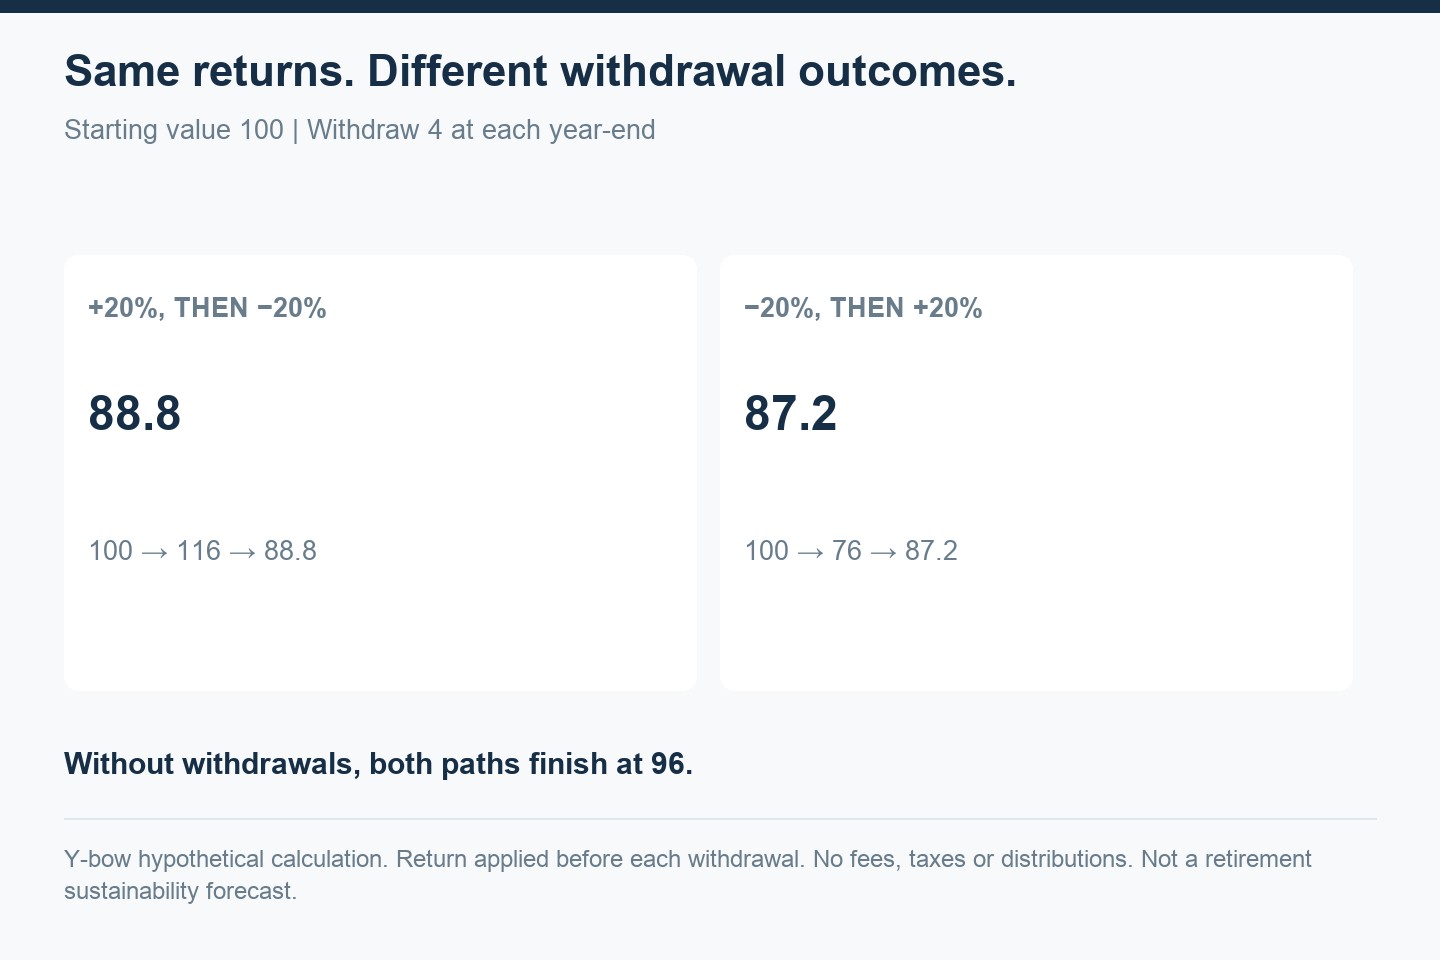
Consider a starting balance of 100 and withdrawals of 4 at each year-end. With returns of +20% then −20%, the balance finishes at 88.8: first 100×1.2−4=116, then 116×0.8−4=88.8. Reverse the returns and it finishes at 87.2.
Without withdrawals both return orders finish at 96. The difference with withdrawals is an example of sequence risk. It does not establish how frequently such paths occur or whether a particular withdrawal rate is sustainable.
Contributions create their own timing effects. A higher final balance can result from more money being invested, not better investment performance. Report contributed capital and profits separately, and distinguish a time-weighted strategy return from a money-weighted personal experience.
Keep comparisons consistent
Use the same date range, currency, benchmark, cash-flow schedule and dividend treatment. Record the rebalancing rule and whether it uses information available at the time. If one ETF launched recently, the common period may exclude an earlier crisis. Extending it with an index proxy creates a simulation that needs clear labeling.
Understand costs before subtracting them. Historical fund total-return data normally already reflects embedded fund expenses. Removing the expense ratio again can double-count that cost. Brokerage charges, taxes, spreads and financing assumptions may still require separate treatment.
Guard against hindsight
Selecting today’s winning companies and pretending you chose them decades ago introduces information you did not have. Excluding failed funds can make a historical sample look better. Optimizing dozens of rules on the same dataset can identify chance rather than a durable advantage.
Reserve data for an out-of-sample check where practical, inspect multiple windows, and evaluate sensitivity to modest changes in assumptions. A complicated rule that collapses when the start month moves is a reason for caution, not a reason to conceal the weaker result.
Write down what the chart cannot show
A backtest may omit trading frictions, changing taxes, limited product availability and your ability to keep investing during a severe loss. It also cannot simulate future market conditions with certainty. Those limits belong beside the chart, not in a distant disclaimer.
Our preferred conclusion is a conditional one: under these inputs and conventions, this historical result followed. Read survivorship bias and return mathematics before converting that conditional result into a decision. This is educational analysis, not personalized advice.
Adapted for the English edition; sources checked October 11, 2026. Original calculations and diagrams by Y-bow. Japanese counterpart.
Comments