
The Buffett indicator compares stock-market capitalization with gross domestic product. It is widely discussed as a broad valuation signal, but its apparent simplicity can be misleading. An expensive market does not come with a reliable countdown to its next decline.
This article explains the ratio without presenting a “current fair value” number. Its most useful role is to prompt questions about valuation assumptions, rather than to act as a stand-alone buy or sell instruction.
A stock divided by a flow
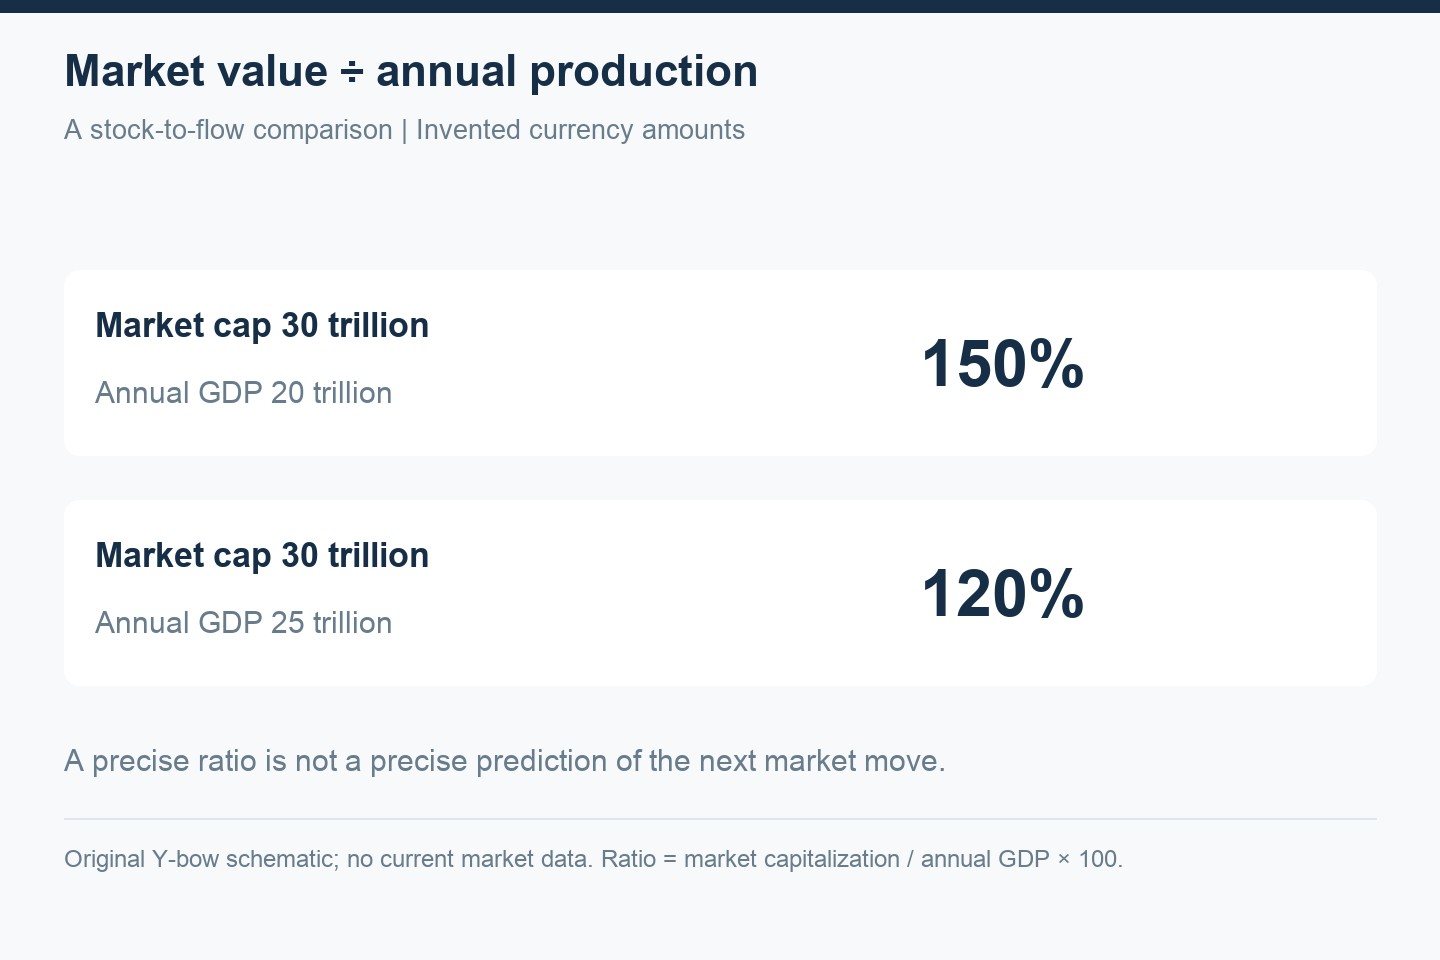
Market capitalization is the value of listed equity at a particular point in time. GDP is the value of production over a period, usually expressed annually. The ratio compares a stock with a flow. It is not the percentage of GDP that shareholders own, and it need not remain below 100%.
The World Bank’s listed domestic companies market-capitalization-to-GDP indicator is one public implementation. Its definition and coverage matter. A domestic listed-company series, a broad US market index estimate and a global equity series are not interchangeable.
Why the numerator and denominator can drift apart
A listed company can earn substantial revenue overseas while its home country’s GDP measures domestic production. The proportion of an economy represented by listed companies also varies: some businesses are private, state-owned or organized differently.
Industry composition changes. An economy with globally successful, profitable listed companies can support a different relationship between market capitalization and GDP from one with a smaller listed sector. Buybacks, new listings, delistings and changes in index coverage affect the numerator without a corresponding one-for-one change in GDP.
These points do not mean valuation is irrelevant. They mean that a historical average is not automatically a timeless equilibrium. Comparisons need a stable definition and an explanation of what may have changed.
A high ratio does not tell you the timing
Asset prices reflect expectations about future profits and the rates used to value them. A high ratio may reflect optimism, low discount rates, strong expected margins or speculative enthusiasm. Those explanations have different implications.
A market can remain richly valued while prices rise further. It can also fall without first reaching an extreme ratio. A valuation lens generally has a stronger conceptual connection to long-horizon expected returns than to tomorrow’s price move, but even that connection is uncertain and depends on assumptions.
Data alignment matters
When reviewing a chart, check whether the market value is year-end, quarter-end or today’s value. Check whether GDP is an annual total or an annualized quarterly estimate, whether it has been revised, and whether both quantities refer to the same country and currency.
Mixing today’s stock prices with an old GDP release can create a precise-looking ratio that conceals a timing mismatch. A change in the ratio may also reflect a revision to the denominator. For cross-country comparisons, listing structure and company coverage add further complications.
Our use: a question generator
We treat the ratio as a prompt to examine the earnings and valuation assumptions embedded in a portfolio. What profit growth would justify current prices? How sensitive is that view to interest rates? What happens if margins normalize? What risks are already concentrated in the largest holdings?
That approach connects the indicator to an investment process rather than turning it into a mechanical exit rule. Our ETF overlap guide helps identify concentration, while the semiconductor supercycle analysis separates industry growth from the return on an expensive stock.
Independent educational interpretation, not a market-timing recommendation. Schematic calculations by Y-bow; sources checked October 11, 2026. Japanese counterpart.

Comments