
A national inflation figure describes a broad average. Your grocery bill, rent and electricity costs describe a particular household. Both can be accurate while telling different stories. This distinction matters for budgeting and investing wherever you live; it is not unique to Japan.
The useful question is not whether the official number matches every receipt. It is which prices you face, how much of your spending they represent, and whether your income and savings keep up. We can separate those questions without assuming that a single inflation statistic captures everyone’s experience.
What an index measures
The US Bureau of Labor Statistics explains that CPI averages can differ from individual inflation experiences. Spending patterns are a central reason. Its CPI FAQ also describes scope and limitations. Other countries publish their own indexes, with different populations, baskets and methods. Do not treat a US index as a measurement of your local costs.
A price index is also different from a forecast. A lower annual inflation rate means that prices are rising more slowly, not necessarily that prices are falling. If prices rise 10% and then 2%, an item initially costing 100 costs 112.20 after both changes.
A simple household basket
Consider two categories: essentials rise 8%, while other purchases rise 2%. Household A spends half its budget on each, so its fixed-basket increase is 5%. Household B spends 80% on essentials and 20% on the rest, giving 6.8%. Neither number is observed national data. They are transparent examples of how expenditure weights change the answer.
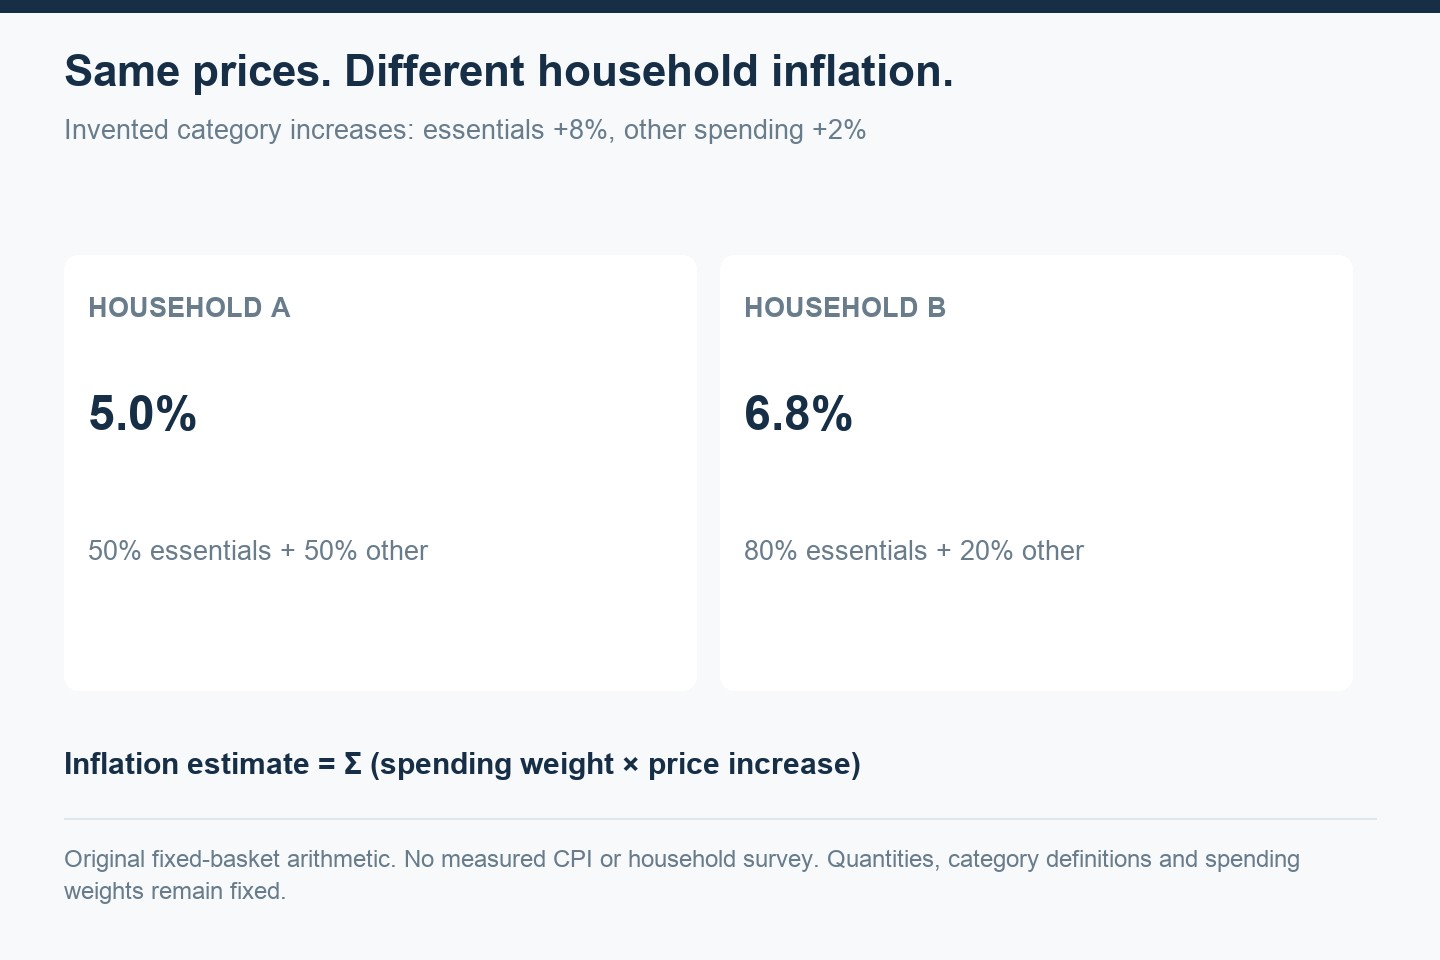
This example keeps quantities and categories fixed. Actual households may switch brands, postpone purchases or change housing. Those choices affect cash spending and living standards differently. Spending less because you cannot afford an item does not mean its price fell.
Real income is a ratio
If nominal income rises 4% while your relevant prices rise 6%, real purchasing power changes by 1.04/1.06 − 1, approximately −1.89%. Subtracting 6 from 4 gives a useful rough estimate of −2%, but the ratio is the exact calculation under these assumptions.
Compare the same periods and consistent income definitions. Gross salary, take-home pay, hours worked and household income are different measures. A pay increase can coexist with lower real income, while a national wage series may not describe your particular job.
Investments and everyday liquidity
Inflation can erode the purchasing power of uninvested money, but that does not make risky assets suitable for every near-term need. Shares can fall precisely when you need cash. Money for rent, emergencies or a known expense deserves a different planning horizon from money invested for decades.
We would first identify essential spending and a realistic cash buffer, then assess long-term purchasing-power risk. No asset is a universal inflation shield. Equity valuations, bond duration, credit risk, currency changes and taxes influence outcomes alongside inflation itself.
A practical reading habit
Track a small, consistent set of your own categories. Compare that with your country’s official release, without presenting a household sample as a superior national statistic. The gap can explain a budgeting problem; it cannot by itself predict the next market move.
For the mathematics of investment results, see CAGR and average returns. For avoiding concentrated bets in response to a macroeconomic headline, read our guide to diversification. These are educational explanations, not personalized investment advice.
Adapted for the English edition; sources checked October 11, 2026. Original calculations and diagrams by Y-bow. Japanese counterpart.



Comments