
Gold bullion, gold-mining companies and a daily leveraged mining ETF are three different exposures. A fund name containing “gold” does not make them interchangeable. Understanding the distinction is more useful than assuming every gold-related ticker provides the same protection during a market shock.
This English adaptation of Y-bow’s gold-miner article uses current issuer documents and an original operating-margin example. The old Japanese article’s historical charts are not reproduced as current evidence, and no past performance ranking is used to predict a winner.
GLD, GDX and NUGT buy different kinds of risk
SPDR Gold Shares (GLD) seeks to reflect gold-bullion prices after trust expenses. VanEck Gold Miners ETF (GDX) targets the MarketVector Global Gold Miners Index, an equity exposure to mining-related companies. Shares in businesses are different from bullion held by a trust.
NUGT’s 2026 summary prospectus specifies a daily 200% objective on the MarketVector Global Gold Miners Index before fees and expenses. It does not directly invest in gold or gold futures. The prospectus records a benchmark change effective September 19, 2025, so older histories should not be treated as a single unchanged index strategy.
Why miners can respond differently from the metal
Consider an invented miner producing one unit of gold. Set its selling price at 100 and its simplified operating cost at 70. The operating surplus is 30. If the selling price increases by 10% to 110 while cost stays 70, surplus rises to 40: an increase of 33.3%. If price falls by 10% to 90, surplus falls to 20: a decline of 33.3%.
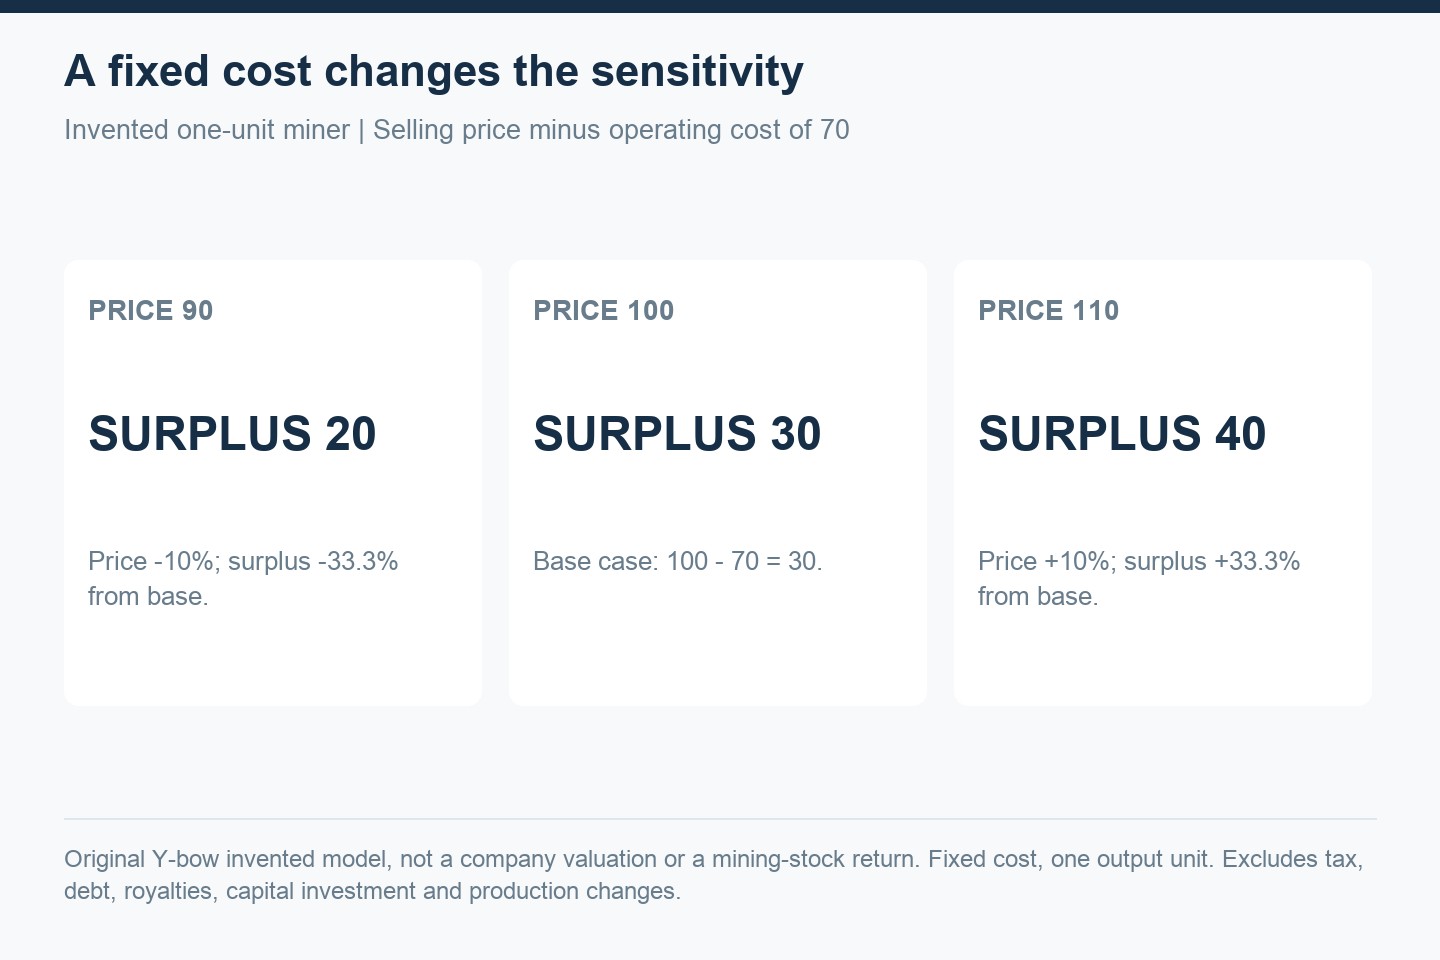
This demonstrates operating sensitivity, not a promise about a mining share price. Real production volumes, energy prices, wages, financing, project execution and valuation can change. In the same invented model, raising both price and cost by 10% gives 110 − 77 = 33, only a 10% increase in surplus. The fixed-cost assumption did much of the work in the first example.
Daily fund leverage adds another layer
The operating-margin example is not the mechanism of a daily 2× ETF. NUGT seeks to amplify the daily return of a mining-share index, which already reflects business and equity-market conditions. It does not simply double a bullion-price change or the hypothetical miner’s operating surplus.
For separate invented index returns of +10% followed by −9.0909%, the unleveraged index returns to its starting point. An ideal daily 2× model ends at 1.20 × 0.8181818 = 0.9818182, or about −1.82%, before costs. This is arithmetic about a specified path, not actual NUGT performance. A different path can produce a different outcome.
The NUGT prospectus warns that returns over periods other than a trading day should not be expected to equal twice the index’s cumulative return, and that the fund requires active monitoring. It is possible to lose money while the benchmark rises. See our daily-leverage guide for the broader mechanics.
A gold thesis still needs a portfolio question
Our interpretation is to start by naming the exposure you intend to hold: metal-price sensitivity, company earnings, or a short-horizon leveraged view on mining equities. These are different hypotheses. A gold-mining fund can hold many companies while remaining concentrated in one industry; multiple holdings alone do not establish broad diversification.
Compare the documents’ dates and benchmarks before comparing historical charts. Include distributions, costs and the currency in which you measure outcomes. Avoid assuming that a dramatic run in one period establishes a reliable hedge in the next. Our diversification guide and backtesting guide provide further context.
Sources checked October 12, 2026. Original models and interpretation by Y-bow; educational explanation, not a recommendation to trade these products. Japanese counterpart.






Comments