
Oil rises, so an energy ETF should rise by the same amount—or more if it is leveraged. That is an appealing shortcut, but it misses what the ETF actually owns exposure to. Energy companies are businesses. A barrel of oil is a commodity. Their returns can move together without being interchangeable.
ERX adds daily leverage to an energy-equity benchmark. To understand it, separate the commodity, the companies and the daily product mechanics.
ERX targets energy shares, not the spot price of oil
Direxion states that ERX seeks 200% of the Energy Select Sector Index's daily performance before fees and expenses. It is a daily +2× energy-equity product, not a +2× crude-oil fund. The objective is not guaranteed. Direxion: ERX and ERY.
This matters when reading older articles. Do not carry forward a historical leverage ratio without checking the current objective. The current issuer page and prospectus are the appropriate reference for what the fund is designed to do now.
| Exposure | What drives the result | An extra question |
|---|---|---|
| Spot oil | The physical commodity price | Can you invest in the quoted price directly? |
| Oil-futures product | Futures prices and contract management | How do contract changes affect returns? |
| Energy-equity fund | Company profits, valuation and distributions | Which businesses and weights are included? |
| ERX | Energy-equity benchmark and daily +2× mechanics | How does the path compound? |
Higher revenue does not pass straight through to equity value
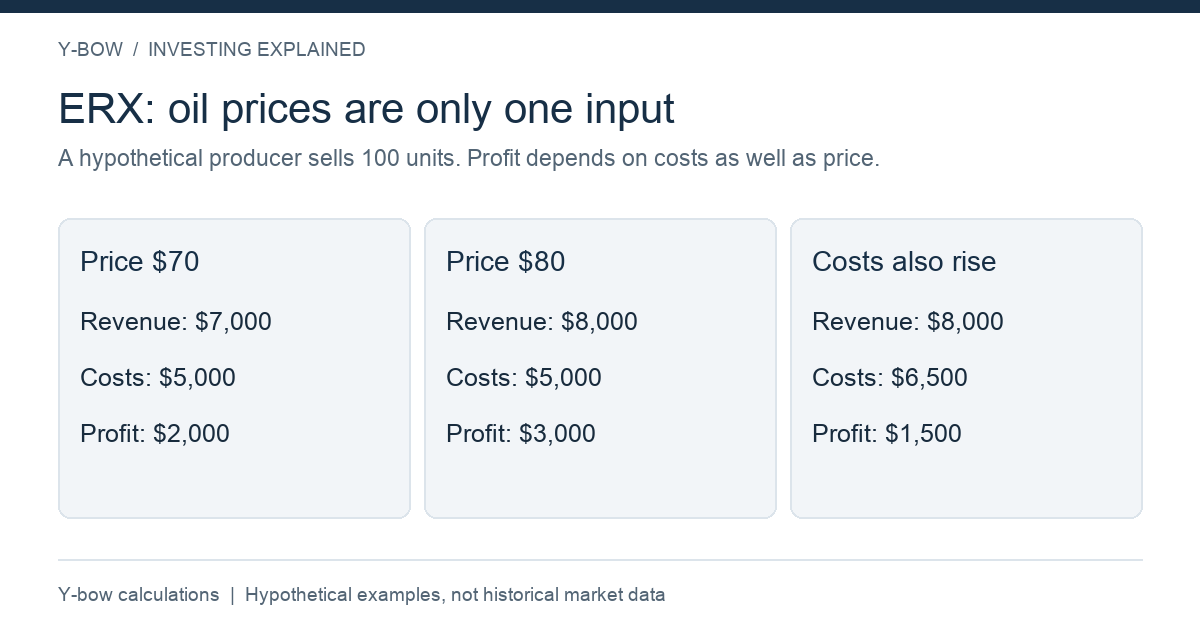
Here is a simplified producer, not an actual company. Suppose it sells 100 units at $70 each and has $5,000 of costs. Its operating profit before other items is $2,000. At a selling price of $80 with the same volumes and costs, that profit becomes $3,000: a 50% increase in profit from a 14.3% increase in the selling price.
But if costs also rise to $6,500, the profit is $1,500 despite the higher selling price. Taxes, debt, hedges, capital expenditure and different business segments introduce further differences. The share price then reflects expectations about future cash flow, not just today's arithmetic.
An integrated company, an exploration business and an oil-services business do not all have the same economics. Read the benchmark holdings to see which types of business dominate the fund's exposure.
Daily 2× leverage creates a second layer of risk
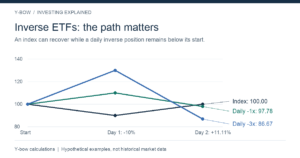
Consider an invented benchmark path of +6% followed by −6%. Starting from 100, the benchmark ends at 99.64. A theoretical +2× daily position gains 12% and then loses 12%, ending at 98.56. This is before all costs and tracking differences, and it is not ERX performance data.
The product is not failing its daily objective in this example. Its two-day result is different because each daily return applies to a changed value. A favorable sustained trend can compound in the other direction, so the issue is path dependence rather than an automatic loss on every holding period.
An energy tilt can already be in your portfolio
A broad equity fund may already hold energy companies. Adding ERX increases the initial notional exposure by more than the cash allocated to the leveraged sleeve. For example, a 5% allocation to a hypothetical +2× fund initially represents approximately 10% benchmark exposure before combining it with the rest of the portfolio.
That exposure changes with market moves. If your employment income or local economy also depends on the energy industry, your household may be less diversified than the brokerage account suggests.
How to research the position without chasing an oil headline
Identify the precise thesis: commodity prices, company profitability, a valuation change, or a short-term sector move. Then identify the risk that would invalidate it. Check current holdings, prospectus expenses, financing-related implementation risks and trading spreads.
A chart should use the same dates and total-return treatment for the benchmark and fund. It should not label energy-equity returns as oil-price returns. Keep account currency and distribution taxes separate from the fund's reported performance.
Continue with daily leverage in an inverse ETF and portfolio diversification. The Japanese ERX guide covers the original topic.
Objective checked October 14, 2026. Business and return examples are hypothetical Y-bow calculations, not company forecasts or actual ERX returns. Product availability varies by jurisdiction.





Comments