
“Materials should benefit from inflation” is a useful hypothesis to investigate, not a reliable investment rule. A company selling raw materials may gain from higher selling prices—or lose the benefit to higher costs, weaker demand and a demanding share valuation.
VAW, XLB and IYM provide different materials-equity exposures. None is the same as directly owning a basket of commodity prices. Start with the index and business mix before drawing conclusions from a sector label.
Compare the benchmarks before the return charts
VAW follows the MSCI US Investable Market Materials 25/50 Index; XLB follows the Materials Select Sector Index drawn from the S&P 500 universe; IYM's current issuer page identifies the Russell 1000 Basic Materials RIC 22.5/45 Capped Index. Vanguard VAW, State Street XLB, iShares IYM.
| Fund | Benchmark frame | What to inspect next |
|---|---|---|
| VAW | U.S. investable-market materials | Company-size and industry mix |
| XLB | S&P 500 materials sector | Large-company concentration |
| IYM | Russell 1000 basic materials, capped | Its distinct classification and weights |
An old description can become inaccurate when a fund changes its benchmark. Record the factsheet date and do not assume that two funds use the same definition of “materials.”
Pricing power determines how inflation reaches profit
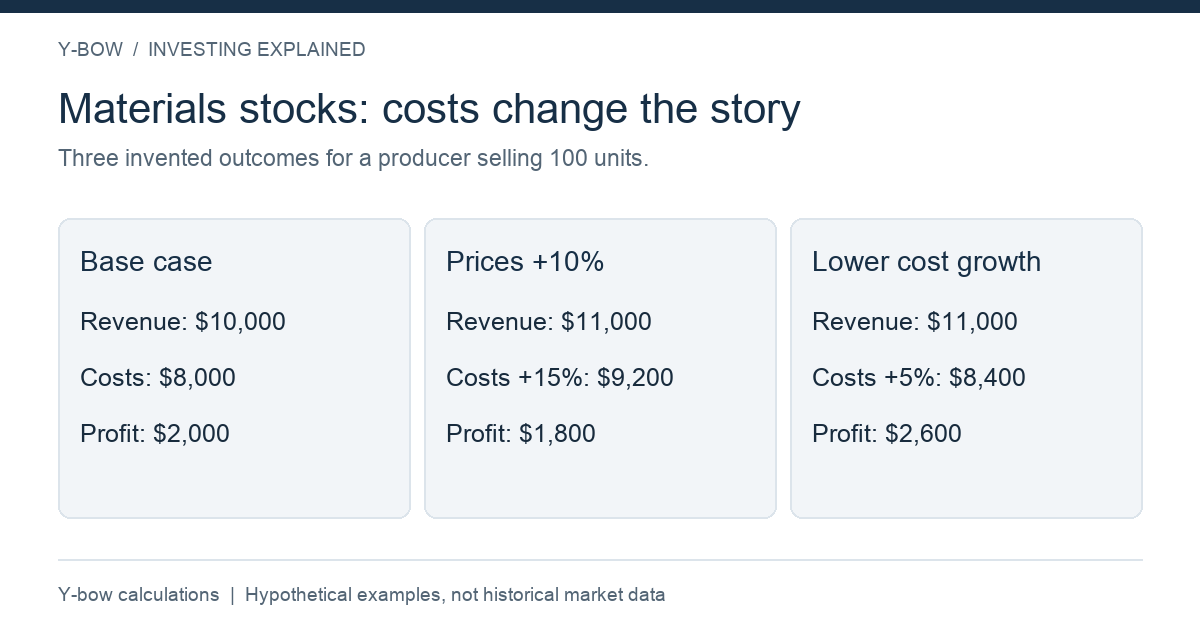
Consider a hypothetical business selling 100 units at $100 with total costs of $8,000. Its operating profit before other items is $2,000. If selling prices rise 10% and costs rise 15%, revenue becomes $11,000 and costs $9,200, leaving $1,800. The higher selling price accompanies a 10% profit decline.
If costs instead rise only 5%, profit becomes $2,600, a 30% increase. Neither scenario forecasts a real company. Together they show why the gap between selling-price growth and cost growth matters more than inflation alone.
The relevant costs also differ across industries. Energy, transportation, wages, raw inputs and financing can affect chemicals, mining and construction materials differently. A sector ETF blends these business models rather than providing one clean macroeconomic exposure.
A low valuation ratio may reflect cyclical peak earnings
Suppose a stock costs $100 and earns $10 per share at a strong point in its cycle. Its P/E is 10. If earnings normalize to $5, the same price corresponds to a P/E of 20. A low trailing multiple can therefore be a signal to examine the earnings cycle rather than proof of a bargain.
Ask whether current margins, volumes and selling prices are sustainable. Separate a temporary profit surge from a durable improvement in the business. A share price may fall while reported profits still look strong if investors expect those profits to weaken.
Sector exposure is not an automatic portfolio hedge
Materials companies remain equities. A recession can reduce both demand and valuations, and many holdings may decline alongside a broad stock market. The sector can behave differently from technology without reliably moving in the opposite direction.
Before adding a fund, calculate the materials exposure already inside your broad funds. A small sector allocation may be a deliberate tilt; buying several overlapping materials ETFs does not necessarily add independent sources of risk.
Costs and performance need a common basis
Use current documents for expenses, holdings and spreads. A lower expense ratio does not remove differences in benchmark scope or concentration. Compare total returns over the same dates, in the same currency, with distributions treated consistently.
If you want commodity exposure, evaluate that separately: a commodity-futures strategy has contract and roll considerations that a materials-equity fund does not replicate. Similarly, owning a gold miner is not the same exposure as owning gold bullion.
A research checklist that survives the next inflation cycle
Record the index name and date, largest holdings, industry weights, current costs and portfolio overlap. Then write the economic thesis in business terms: which prices can rise, which costs can be passed through, and what could reduce demand?
Continue with stock heatmaps and valuation traps and portfolio diversification. The Japanese materials ETF article is the companion.
Benchmark information checked October 14, 2026. Examples and diagrams: Y-bow, hypothetical calculations before interest, taxes and other items. They are not company forecasts or actual fund returns.





Comments