
People who read more books may also earn more money. Even if a survey establishes that association, it does not establish what would happen to someone’s income if they bought and read five additional books. The difference between describing a pattern and predicting the effect of an intervention is the central question.
This English adaptation of Y-bow’s article about reading and income focuses on a statistical lesson that travels across countries. Instead of carrying over a dated Japanese survey, we use a clearly invented example whose assumptions can be inspected.
What correlation measures
A correlation coefficient summarizes an association. For Pearson’s r, values range from −1 to +1 and describe the direction and strength of a linear relationship. A strong value alone does not identify a cause. See OpenStax’s explanation of the correlation coefficient.
The distinction changes the question you ask. “Do these variables occur together?” can be answered differently from “Will changing the first variable change the second?” If the goal is a practical decision, the second question usually matters more.
An invented survey with a strong pattern
Imagine four people. Two belong to group A and have annual incomes of 30 units each; they read one and two books a month. Two belong to group B and have incomes of 70 units each; they read four and five books a month. The units are fictional, and the four people are not a real sample.
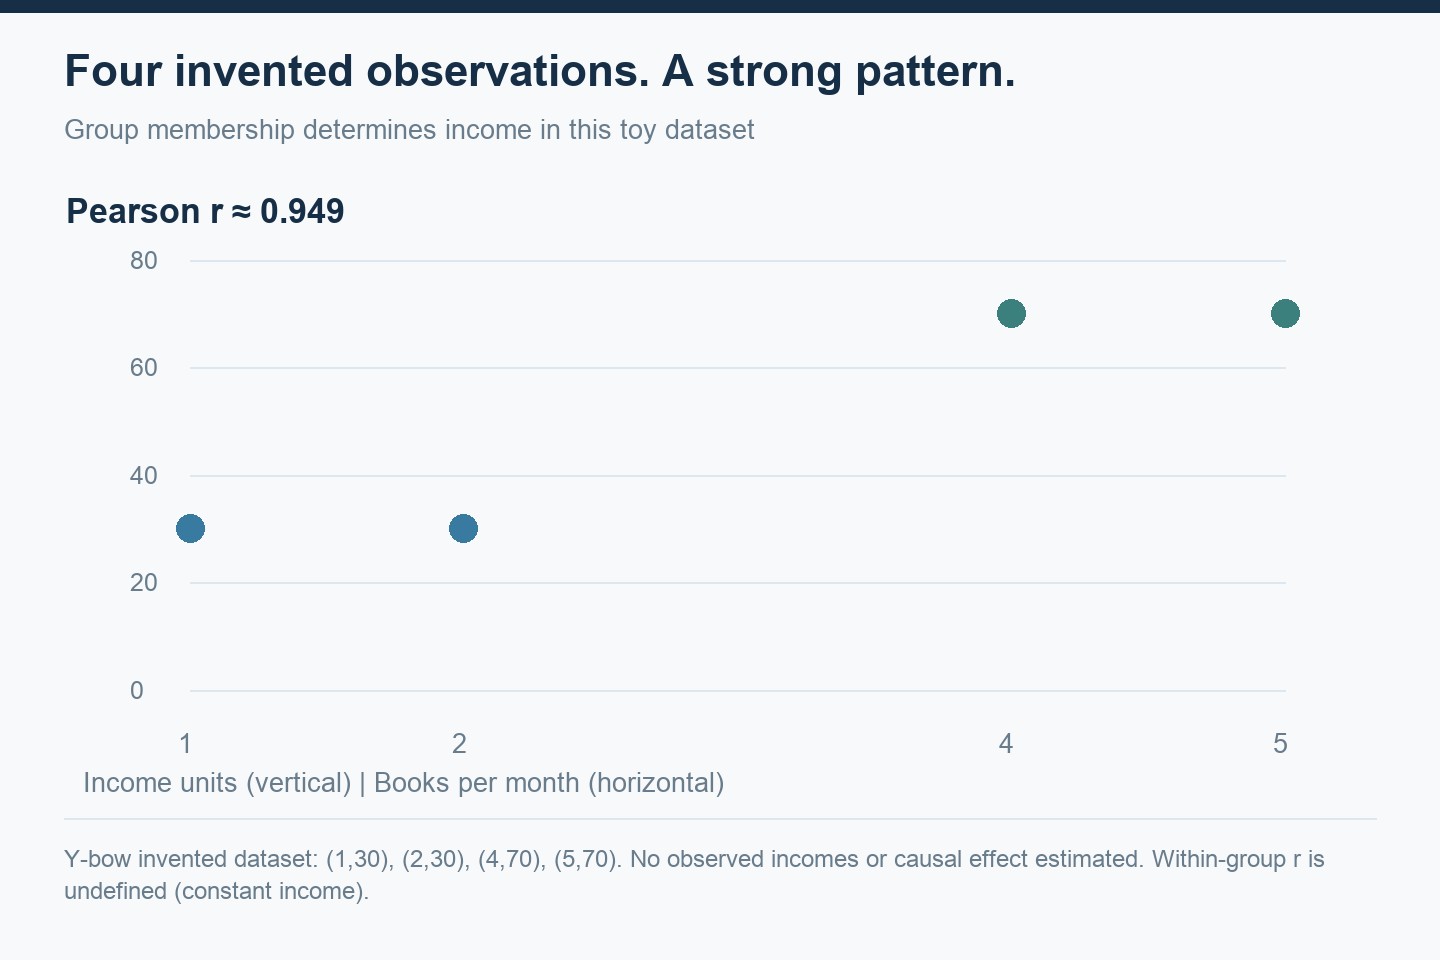
The mean book count is three, and mean income is 50. The centered book counts are −2, −1, +1 and +2; the centered incomes are −20, −20, +20 and +20. The sum of their products is 120. Dividing by √(10 × 1,600) gives r ≈ 0.949—a strong positive correlation.
Yet in this invented system, reading another book does not determine the assigned income. Group membership does. Within each group, income is constant even though book counts differ. The within-group correlation is undefined because income has zero variance; it would be incorrect to report that coefficient as zero. This small technical point matters when a chart appears to contradict a headline.
Several stories can fit the same chart
In a real study, reading might improve useful skills. Alternatively, a higher income might make books, education and leisure time easier to obtain. A third factor might influence both. Occupation, education, age or working hours are possible questions for the investigator, rather than explanations established by our diagram.
OpenStax’s discussion of analyzing research findings explains how an additional variable can produce an association. Naming a possible confounder is useful, but it does not prove that the confounder accounts for a particular real-world result. That claim also requires evidence.
Ask what was measured and how. A one-time questionnaire, a follow-up study and a randomized intervention answer different questions. A self-selected sample of enthusiastic readers may differ from the population a headline claims to describe. Timing, selection and measurement are part of the result, not administrative details to skip.
Statistical evidence and a personal reading habit
You do not need a salary guarantee to find reading valuable. A book can help you understand a problem, question an assumption or learn a skill you actually use. A practical experiment might be to choose one useful idea, apply it and record what changed. The outcome you observe will be specific to that activity, rather than proof of a universal income effect.
Our interpretation is that advice becomes stronger when the claimed benefit matches the available evidence. “This helped me understand fees” is narrower and easier to examine than “readers become rich.” A memorable recommendation and an established causal relationship are different kinds of statement.
Use the same habit when evaluating investments
A chart linking an indicator with stock returns raises similar questions about time periods, omitted variables and the selection of observations. Our guides to portfolio backtesting and survivorship bias extend this reading habit to investment evidence.
Sources checked October 12, 2026. Statistical references: OpenStax, linked above. Dataset, calculation and diagram by Y-bow; no real income survey reproduced. Japanese counterpart.





Comments