

Two-thirds in TQQQ, one-third in cash: three times two-thirds equals two. It sounds like a simple substitute for QLD, with a cash reserve left over. Why buy a daily 2x fund if a daily 3x fund can apparently do the same job?
The missing question is what happens after the first price move. Your cash does not rise alongside TQQQ, and it does not fall alongside it either. The mix changes. A calculation that matches at purchase can become a different position the next morning.
Sources checked October 25, 2026. US-listed ProShares TQQQ and QLD. All paths below are hypothetical arithmetic, not actual ETF returns or a forecast.
TQQQ plus cash vs QLD: match the starting exposure first
The current QLD summary prospectus targets twice the Nasdaq-100’s daily performance before fees and expenses. TQQQ targets three times the daily result. Neither promises its multiple of the index’s cumulative return over an arbitrary holding period.
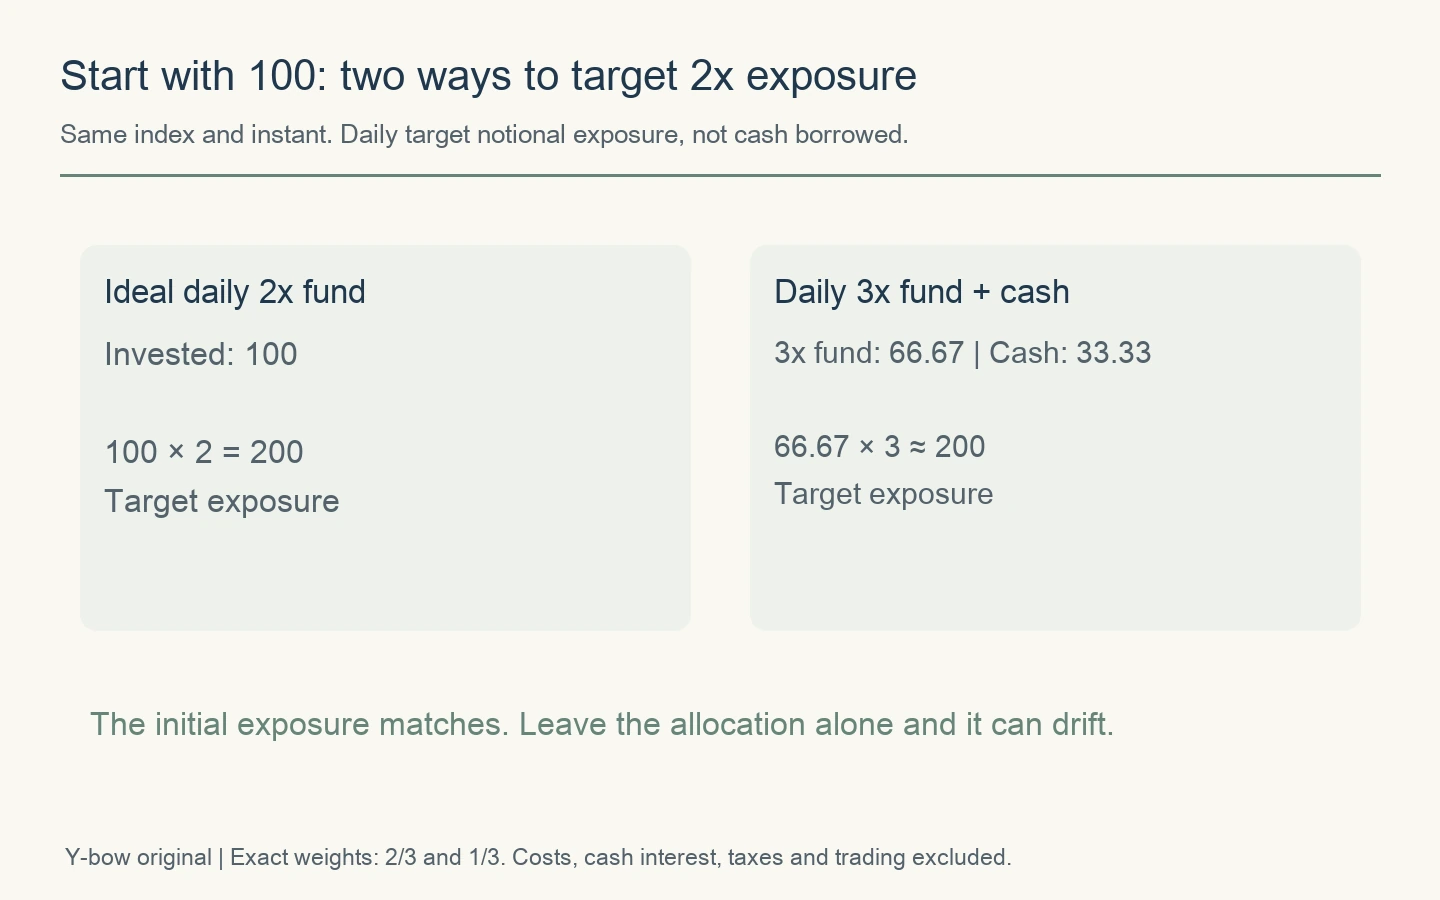
Start with 100 units of capital. Investing all 100 in an ideal daily 2x fund gives target index exposure of 200. Put exactly two-thirds of the capital into an ideal daily 3x fund and retain one-third as zero-interest cash: (100 × 2/3) × 3 = 200. At that instant, the target exposure matches.
The denominator is the current account value
The mixed account’s next daily target exposure is approximately 3 × current TQQQ value ÷ total current account value. It is not three times the original dollar allocation divided by the original deposit forever.
That distinction matters when the account includes an emergency reserve. Counting money as part of the denominator makes measured leverage look smaller. It does not establish that the money is available to buy more TQQQ after a decline. Define the investment account before calculating its exposure.
A two-day example: up 10%, then down 10%
Assume perfect daily target returns, no fees, no taxes, no distributions, no trading frictions and zero cash interest. The index moves 100 → 110 → 99. An ideal daily 2x fund moves 100 → 120 → 96. Doubling the index’s final 1% loss would give the wrong answer.
In the mixed account, the initial 66.666… invested in the daily 3x fund rises 30% to 86.666…. Cash stays at 33.333…, so the total is 120. So far, the accounts match.
Leave the allocation untouched. On day two, the 86.666… fund position loses 30%, finishing at 60.666…. Add the unchanged cash and the account ends at 94, rather than 96. There were no fees in this example. The gap comes from a different exposure entering the second day.
Reverse the order: lower exposure before the rebound
If the index falls 10% first, the 3x position falls to 46.666… and the combined account to 80. Next-day target exposure becomes 3 × 46.666… ÷ 80 = 1.75x. A subsequent 10% index rise still leaves the mixed account at 94.
Notice a useful limit to the “path matters” explanation. Reversing this identical set of daily returns changes intermediate account values and exposure, but it does not change the final untouched mixed-account value. With no cash flows, the same multiplication factors produce the same product. Trades, contributions and withdrawals can change that result; simply swapping these two factors cannot.
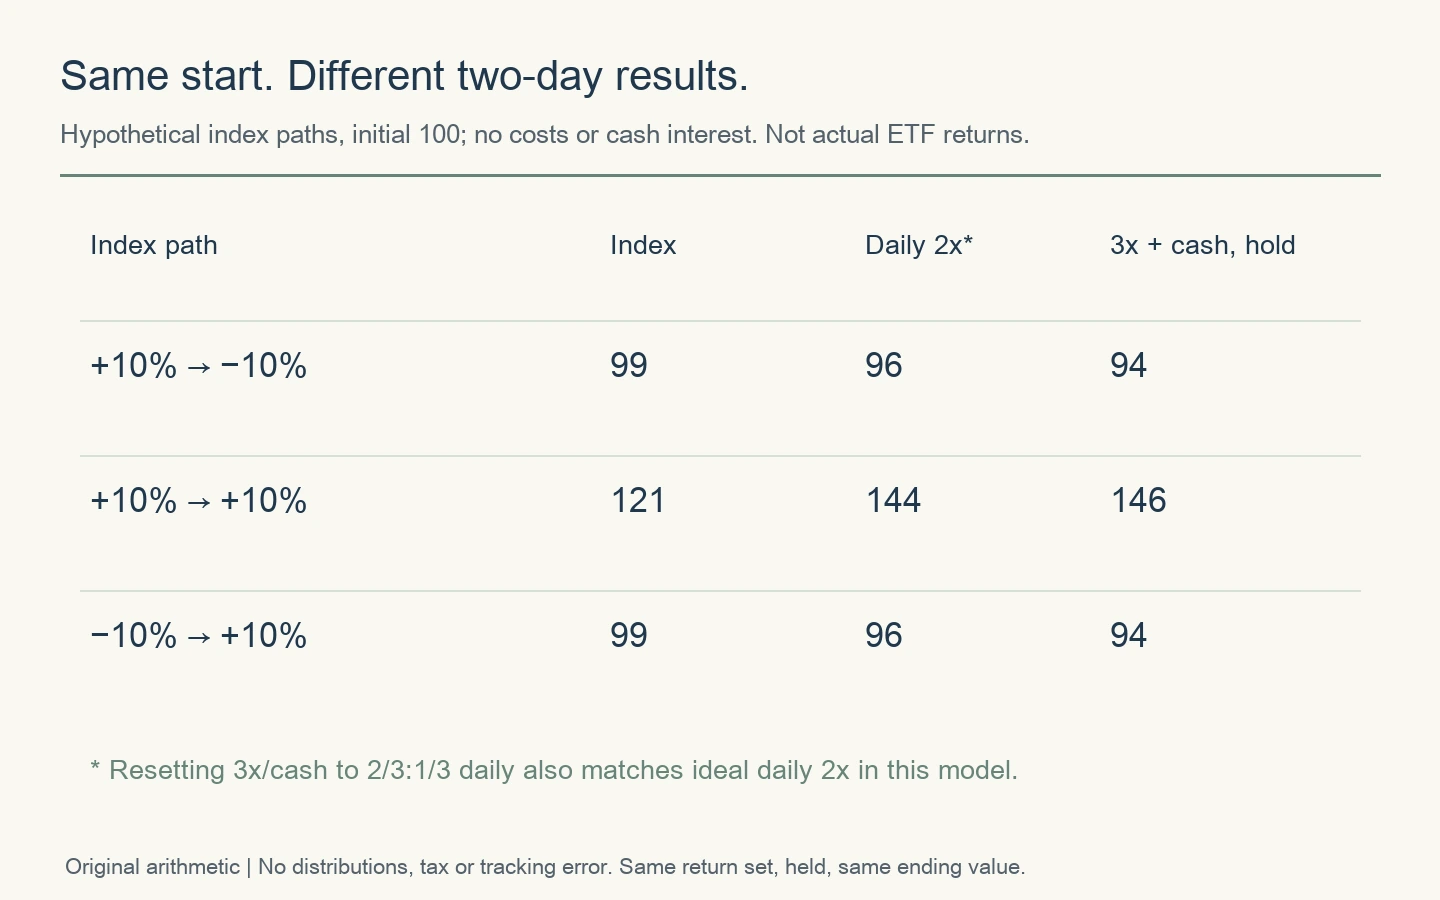
For two consecutive 10% index gains, the ideal daily 2x fund ends at 144 and the untouched 3x/cash account at 146. Drift does not always hurt returns. Here the rising equity weight increases exposure before another gain. It also leaves the account more exposed if the next move is a decline. The higher ending number is not evidence of a free advantage.
Advertisement
Does daily rebalancing make TQQQ and cash equal to QLD?
In an ideal model, resetting to two-thirds 3x exposure and one-third cash each day gives the same daily multiplication factor as a 2x fund. For account value V and next-day index return r, the result is V × [(2/3) × (1 + 3r) + 1/3] = V × (1 + 2r).
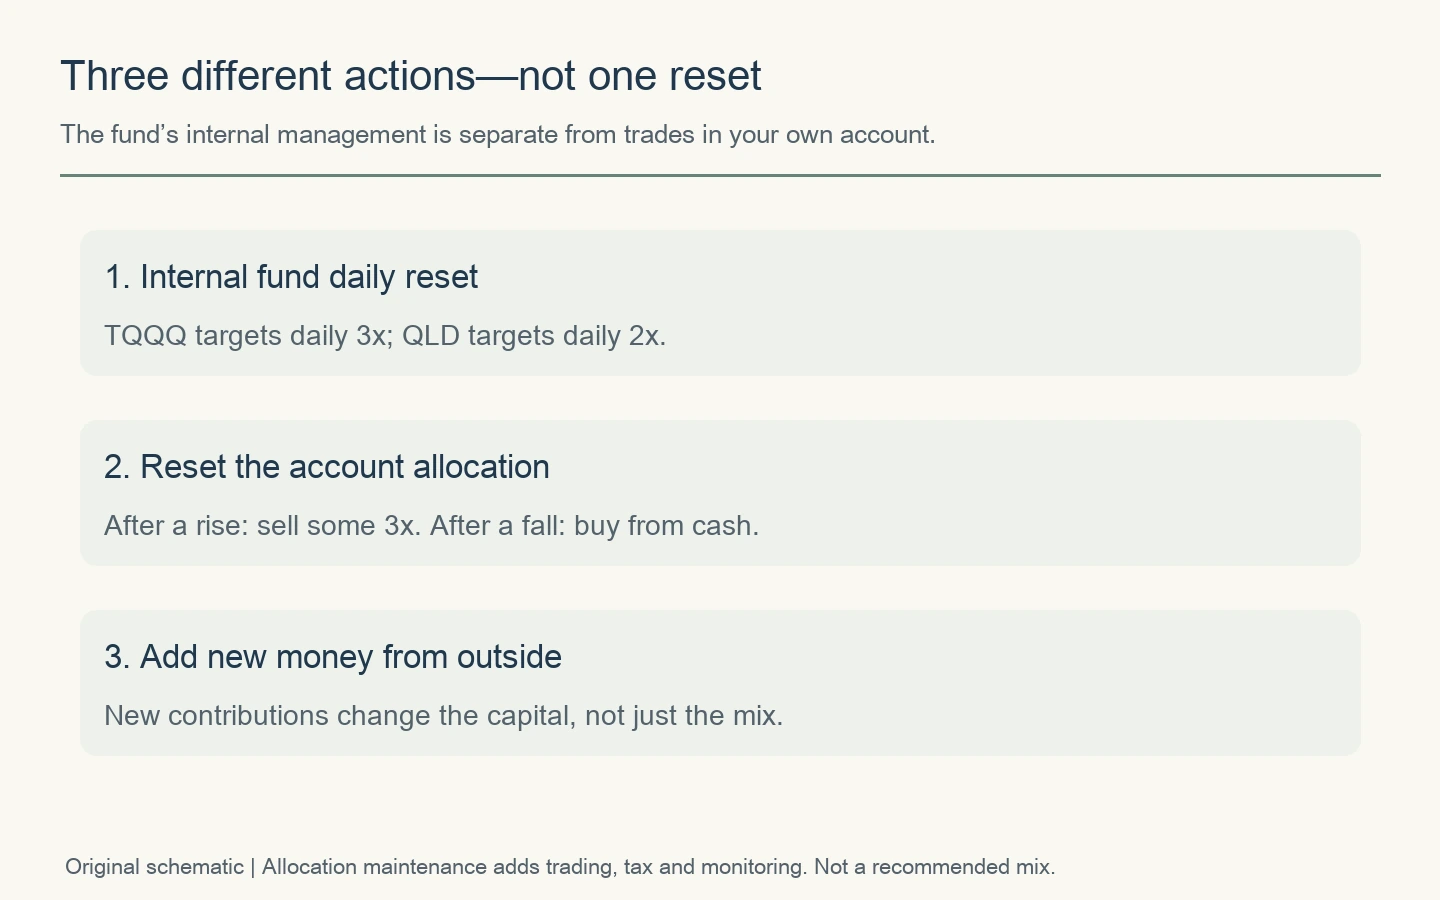
After the first up day, reset the 120 account to 80 in the 3x fund and 40 cash. That requires selling 6.666… of the fund position. If the index then falls 10%, the account becomes 80 × 0.7 + 40 = 96.
After a first-day decline, restoring the mix instead requires buying. The 80 account needs 53.333… in the fund, so transfer 6.666… from cash into the position. This is an explicit sell-after-gains, buy-after-losses rule. It is not the same as buying a cash-buffered position once and leaving it alone.
A fund reset is not your portfolio rebalance
ProShares’ rebalancing explanation and calculator distinguish daily fund objectives from holding-period outcomes and investor management. Our constant two-thirds portfolio allocation is a specific classroom rule; it should not be confused with every position-adjustment method illustrated by the issuer’s tool.
Monthly rebalancing, a threshold rule and buying more with each paycheck are different strategies. They can produce different exposures and tax outcomes. A comparison that gives one strategy fresh contributions but compares only final balances confuses additional capital with investment performance.
Five reasons actual results can still differ
| Item | What to align | Common mistake |
|---|---|---|
| Fund economics | Current disclosure dates and NAV returns | Treating the expense ratio as the only economic difference |
| Cash income | Currency, vehicle and after-tax yield | Applying the zero-interest illustration as a forecast |
| Rebalancing | Frequency, timing and trade rule | Assuming the ETF resets your account weights |
| Trading and tax | Spread, commissions and realized gains | Ignoring account type and tax residence |
| Household reserves | Investable cash versus emergency funds | Counting essential spending money as rebalance capital |
The argument “only two-thirds pays TQQQ’s expense ratio” is not a complete cost comparison. Derivative financing, collateral income and tracking also matter, as do investor trades. Do not estimate an undisclosed all-in cost merely by multiplying a headline ratio. The daily-leverage and compounding guide explains why a holding-period gap from three times an index return is not automatically a fee.
Cash is not automatically SGOV—or your spending reserve
Replacing cash with a short-term Treasury ETF creates another asset with its own return, distributions, expenses, trading price and spread. An exchange-traded holding is not identical to a bank deposit or a constant dollar balance. Model the actual vehicle rather than changing the label in a zero-interest example.
Currency matters too. A dollar reserve can be stable in dollars and move sharply relative to euro, pound or yen living costs. Your emergency fund has a different job from capital committed to buying more leveraged exposure. The same pile of money cannot be assumed to serve both purposes at the same time.
Decide what happens after a loss before choosing the allocation
The practical question is not which row has the largest ending value. Could you follow the stated rule after the account falls to 80? Would you buy more of the leveraged fund from cash? Would you sell some after a rally? What happens when you cannot monitor the account or when markets move while your local bank is closed?
Those are operating requirements, not details to add after deciding the strategy is safe. Less frequent adjustment may be easier to maintain, but then the exposure will not follow the ideal daily-rebalanced calculation. More frequent trading may reduce allocation drift while increasing other burdens. Neither fact makes one approach universally superior.
- Measure exposure using current account values.
- Write down whether and when you restore the mix.
- Exclude essential household reserves from funds available for rebalancing.
- Match initial capital, external cash flows and currency in comparisons.
- Check whether the process remains workable after costs, taxes and sharp losses.
The useful takeaway is “2x at the start; exposure afterward depends on the allocation rule.” It is more precise than saying two-thirds TQQQ “is QLD.” For broader position controls, see the leveraged ETF risk-controls guide. Choosing no leveraged fund is also a valid outcome of that review.
Sources, formulas and updates
Primary sources: ProShares’ September 28, 2026 QLD and TQQQ summary prospectuses, geared-fund FAQ and the rebalancing resource linked above. All three diagrams are original. Two-day formulas: ideal daily 2x = 100(1 + 2r₁)(1 + 2r₂); untouched 3x/cash = 100/3 + (200/3)(1 + 3r₁)(1 + 3r₂).
The examples deliberately exclude costs, interest, taxes, flows, distributions and imperfect tracking. Product-objective changes require a new source check. These calculations do not establish a suitable allocation or predict actual returns.




Comments