
You bought Treasury ETFs expecting Federal Reserve cuts to help. The Fed eased, but your bond position lost value. If equities also fell, the asset meant to make the portfolio feel safer may have created a second source of anxiety.
The first question is which market yield your fund responds to, and how strongly. An overnight policy-rate decision is different from the return investors demand for lending over the next ten, twenty or thirty years.
Sources checked October 24, 2026. ETF comparison observations are dated October 22, 2026. The historical illustration uses two dates in 2024; it is not a forecast or a current trading signal.
Why can Treasury ETFs fall after Fed rate cuts?
When market yields rise, existing fixed-rate bonds generally become less valuable. Their prices adjust so that older coupons can compete with newly available yields. The SEC’s investor bulletin explains that interest-rate risk applies to Treasury bonds too.
But the relevant market yield is not necessarily the federal funds target. Longer yields reflect expectations about future short rates, inflation and compensation for holding long-term risk, among other influences. Expected policy easing can also be priced before the announcement.
A historical example: policy eased while the ten-year yield rose
On September 18, 2024, the Fed reduced its target range to 4.75–5.00%. By December 18, it was 4.25–4.50%. Across those same dates, the daily ten-year Treasury yield rose from 3.70% to 4.50%. Source: FRED DGS10, originally from the Federal Reserve.
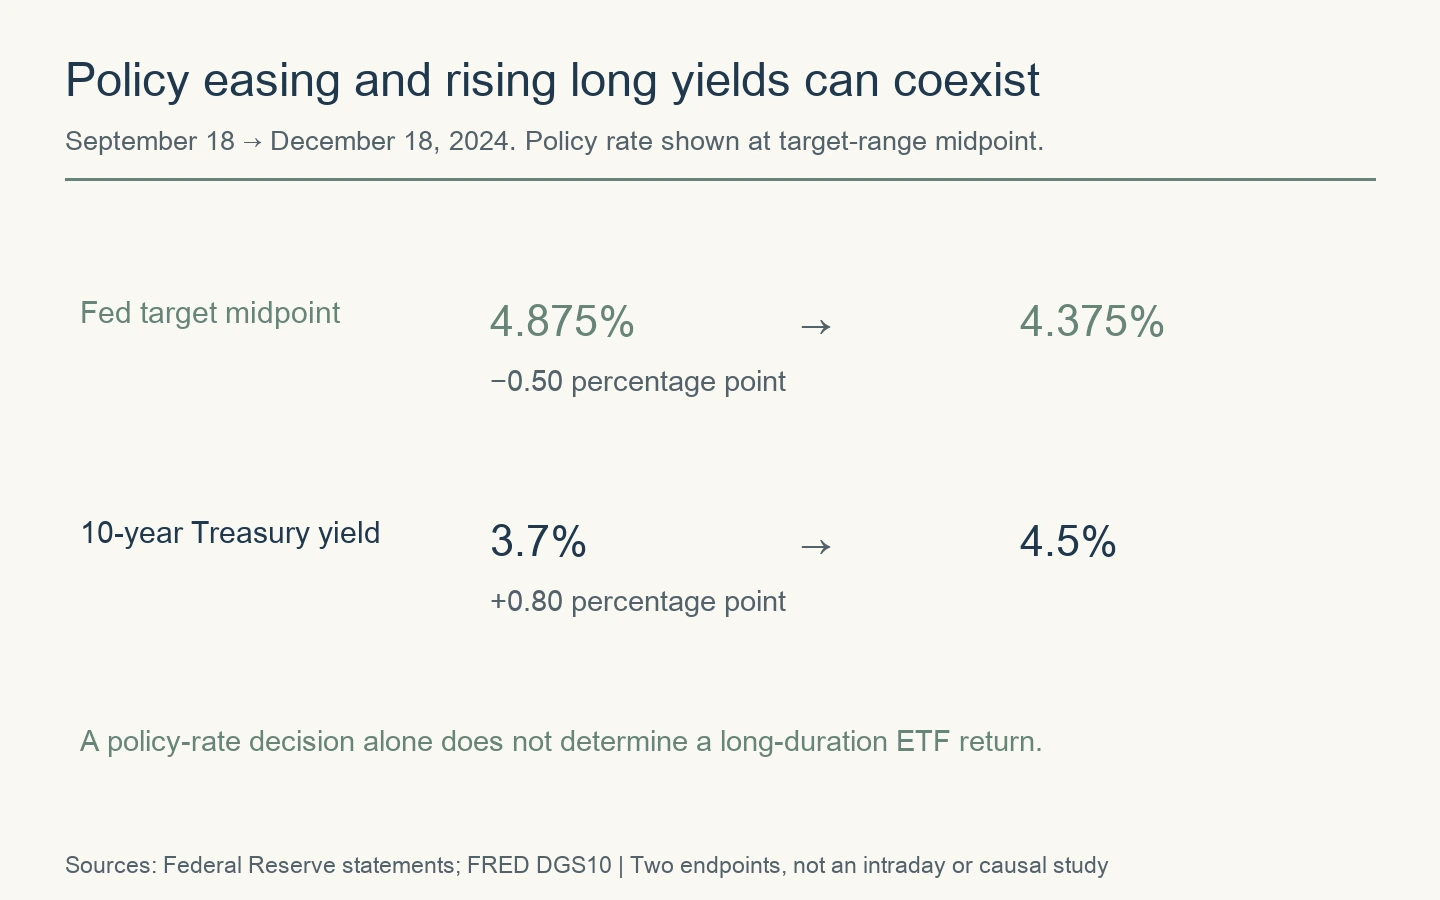
This does not mean cuts cause long yields to rise. It shows why the policy direction alone cannot establish the long-yield direction. Nor is the ten-year series sufficient to calculate the actual return of TLT, which targets a longer maturity segment.
TLT vs IEF vs SGOV: compare the maturity exposure
The three funds target different Treasury maturity segments. Remaining maturity and duration are different measures. The following observations use a common issuer reporting date, and will change with holdings and market conditions.
← Swipe to view the full table →
| ETF / target segment | Effective duration | 30-day SEC yield | Annual expense ratio |
|---|---|---|---|
| TLT / over 20 years | 14.96 years | 5.30% | 0.15% |
| IEF / 7–10 years | 6.84 years | 4.99% | 0.15% |
| SGOV / 0–3 months | 0.12 years | 3.76% | 0.09% |
Issuer sources and current prospectuses: TLT, IEF and SGOV. Expense ratios are the prospectus figures displayed when checked.
The highest displayed yield is not automatically the best match
Ranking only the yield column omits how much price movement you accept while earning the income. Money needed for a near-term dollar bill and a position intended to benefit from falling long yields have different jobs.
A short Treasury ETF is not an insured bank deposit or a personal principal guarantee. It trades at a market price, has costs and can have a bid-ask spread. As short instruments roll over at lower rates, income can decline. Low price sensitivity is different from locking today’s income for years.
What is duration, and how do you estimate a bond-price move?
Duration is expressed in years, but it is not simply time until maturity. It measures interest-rate sensitivity. Macaulay, modified and effective duration are related but distinct calculations; read the label. FINRA explains these distinctions.
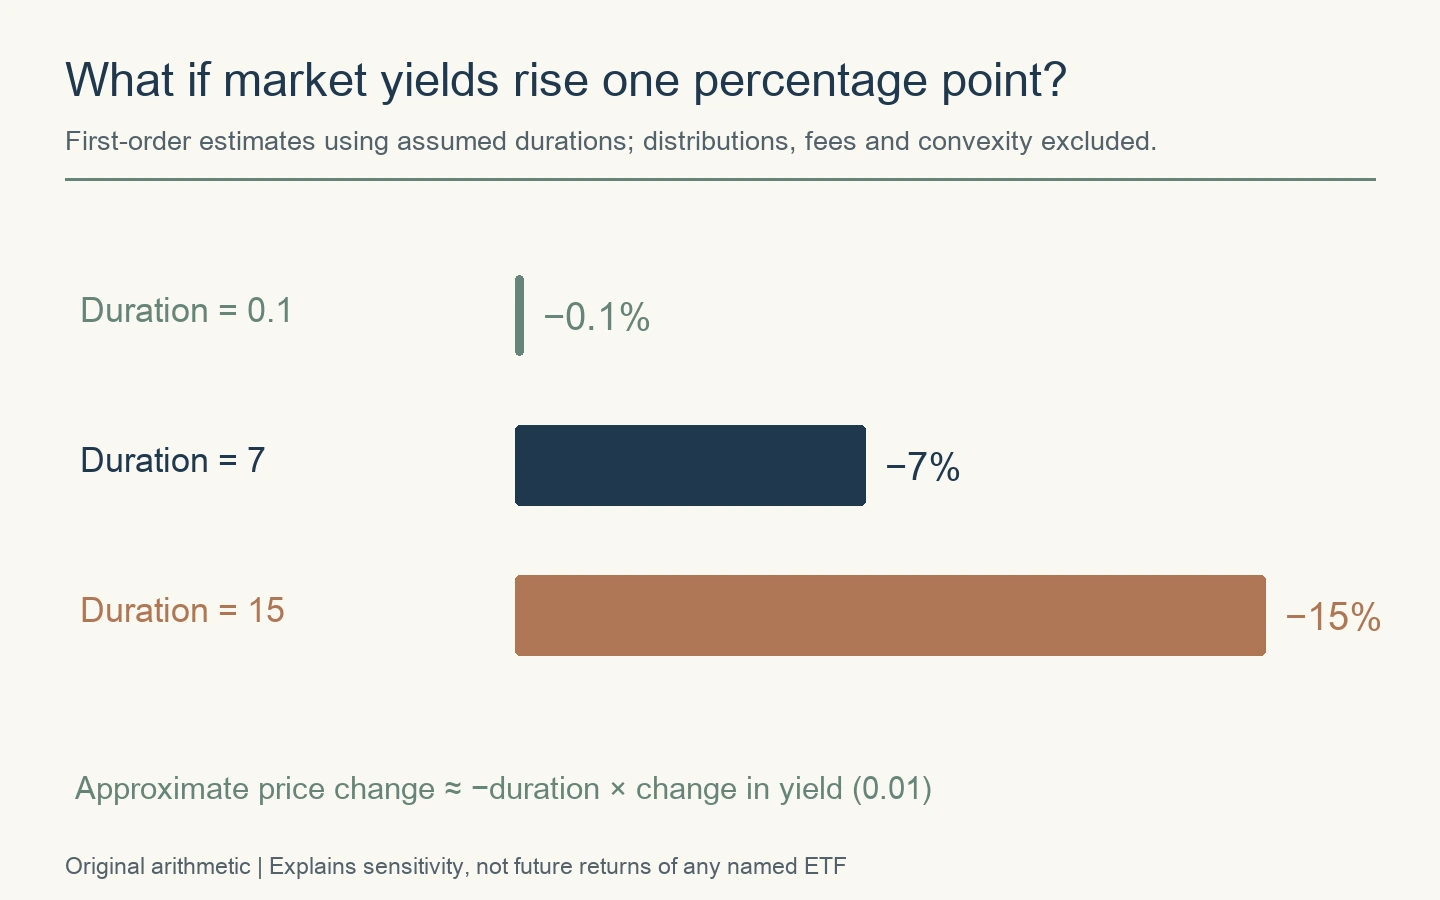
A rise from 4% to 5% is 0.01, or one percentage point. Do not substitute the 25% relative increase from four to five.
Using assumed durations of 0.1, seven and fifteen, a one-percentage-point yield increase gives estimated price moves of −0.1%, −7% and −15%. Half that yield change gives half the first-order movement. Reversing the sign reverses the approximation, not necessarily the exact realized price movement.
Duration is neither a maximum loss nor a recovery timer
A duration of fifteen does not cap losses at 15%, and it does not say your purchase price will return after fifteen years. Approximation error grows with larger yield moves. Different changes at two, ten and thirty years also complicate a single-duration estimate.
Translate the scenario into money. A 15% move on a $10,000 position is $1,500. Ask whether that fits the role of the funds alongside the rest of your portfolio. The third decimal place of a duration estimate is less important than discovering that your “cash buffer” can move by an uncomfortable dollar amount.
Advertisement
Distributions, SEC yield and total return are different
A price-only chart misses income. Isolate a hypothetical distribution: an asset valued at 100 pays 0.4, leaving 99.6 before other market changes. The investor has 99.6 plus 0.4, still 100. The distribution alone created neither a 0.4 loss nor an additional 0.4 gain.
Real market prices also move with yields and trading conditions. For performance comparisons, use consistently defined total returns and state whether distributions are reinvested. Do not compare one fund’s price-only chart with another fund’s reinvested return.
What the 30-day SEC yield does not promise
The SEC yield standardizes recent income over a thirty-day period into an annualized measure. It differs from a trailing distribution yield and from yield to maturity. None is a promise of your next twelve months’ total return.
A portfolio’s yield-to-maturity figure does not freeze a rolling ETF’s future holdings or your personal result. Entry price, costs, holding period and reinvestment conditions matter. Use consistent expense treatment rather than subtracting fund costs a second time from an already net reported return.
Why holding a Treasury ETF is different from holding a bond to maturity
An individual bond promises face value at maturity if its issuer performs. That face value need not equal a premium purchase price. A rolling maturity-band ETF such as TLT or IEF does not promise to return each shareholder’s purchase cost on a specified personal maturity date.
Fidelity’s bond-versus-fund comparison explains the maturity distinction. Defined-maturity ETFs are another category and should not be assumed to have the same structure as these three funds.
Treasuries do not guarantee an offset to every stock-market loss
The reason equities are falling matters. A slowdown accompanied by lower yields differs from a shock involving inflation or rising long yields. A hedge that helped in one episode need not produce the same result in another.
Test an adverse combination: stocks fall while the yields relevant to your bond fund rise. Compare the resulting dollar amounts with spending needs and your overall exposure. Historical diversification is useful evidence, but it is not insurance with a fixed payout.
Your spending currency can change the result
A US investor paying future dollar expenses and an overseas investor funding local-currency expenses face different questions. For an unhedged foreign holding, currency translation can dominate the bond return.
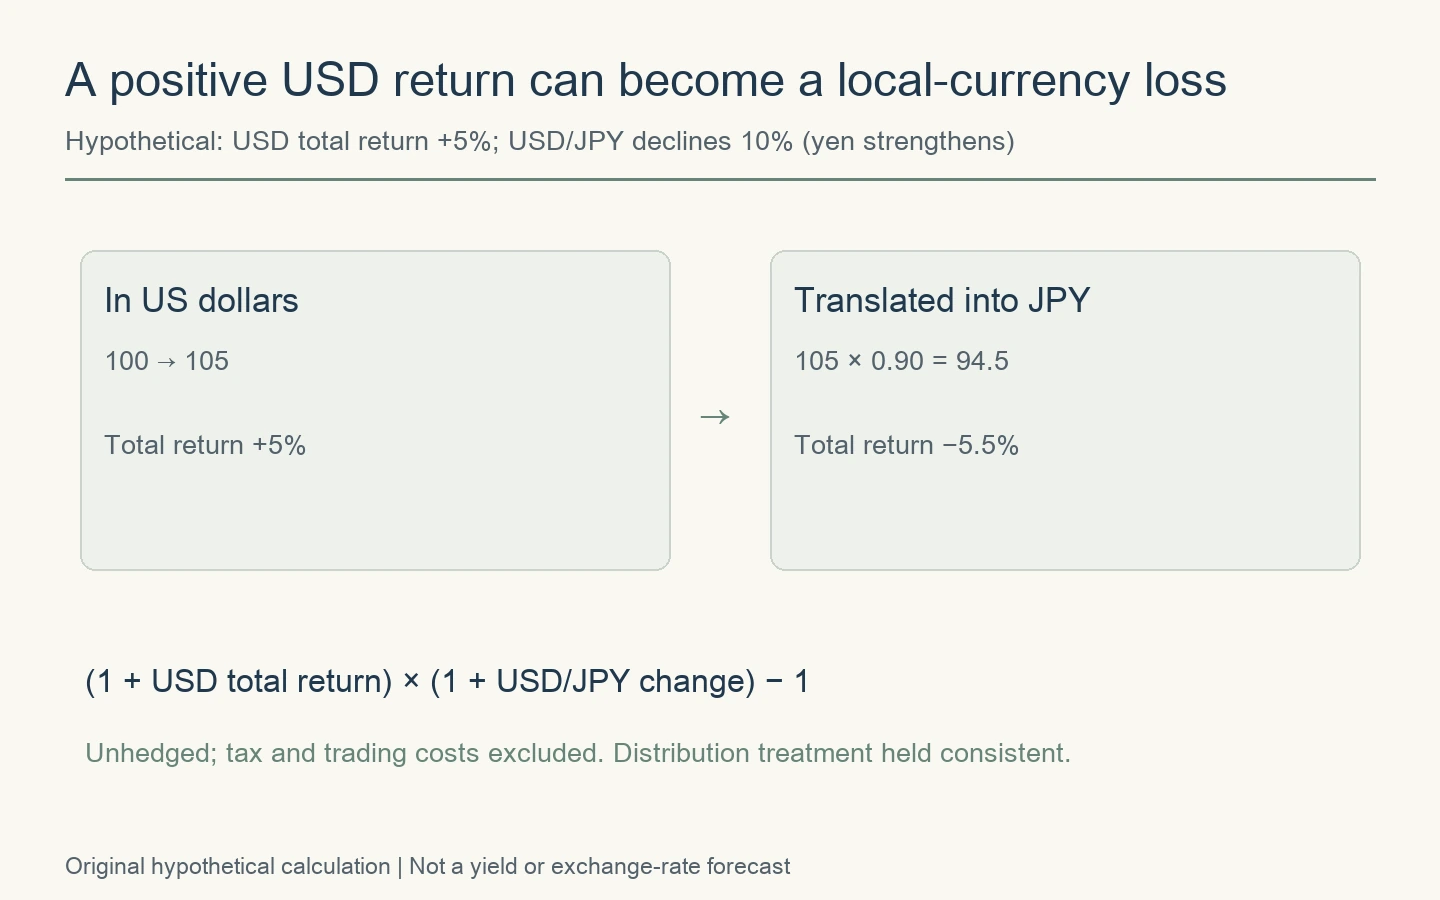
For example, a +5% USD total return combined with a 10% decline in USD/JPY gives 1.05 × 0.90 − 1 = −5.5% in yen under consistent simplified distribution treatment. It is not +5% minus 10% exactly; returns multiply.
Hedging can change currency exposure, but has costs and tracking effects. Taxes, account type, product availability and delivery restrictions also depend on residence and jurisdiction. A US-listed ticker being searchable does not establish suitability or access everywhere.
A purpose-first checklist for Treasury ETF investors
← Swipe to view the full table →
| Purpose | Check first | Avoid assuming |
|---|---|---|
| Near-term dollar spending | Horizon, liquidity and price fluctuation | A short ETF is an insured deposit |
| Exposure to falling yields | Relevant maturity, sensitivity and position size | Fed cuts alone establish the return |
| Portfolio diversification | Joint adverse scenarios and total dollar risk | Bonds always rise when stocks fall |
| Foreign-currency spending | Exchange rate, hedging and conversion dates | USD yield is a guaranteed local return |
| Regular income | Total return, changing payouts, costs and tax | Every distribution is additional profit |
I would write down when the money is needed and what decline would disrupt that plan before choosing a ticker. Extending duration to chase a little more yield can quietly turn a reserve position into a large interest-rate view.
Execution matters too. Our ETF order and bid-ask spread guide covers the difference between choosing an exposure and getting an acceptable execution price. For a broader starting framework, see the beginner investing plan.
Frequently asked Treasury ETF questions
Should I buy TLT before the next rate cut?
The answer does not follow from predicting a meeting. Existing expectations, the long-yield response, your horizon and entry price all matter. A correct policy forecast need not produce a profitable trade.
Does SGOV lock in today’s yield?
No. Short instruments mature and are replaced, changing future income. Low duration does not make the current payout permanent.
Are AGG and BND interchangeable with this comparison?
No. Broad aggregate bond funds include other exposures, such as corporate and mortgage-related securities. Their risks cannot be reduced to the same Treasury maturity comparison.
Sources, calculation limits and updates
Fund specifications come from the three linked issuer pages. Historical observations come from Fed statements and FRED DGS10. SEC, FINRA and Fidelity explain the underlying mechanisms. The three figures are original; no issuer chart is reproduced.
The sensitivity illustration uses assumed modified durations in a first-order calculation, distinct from the effective-duration observations in the issuer comparison. Updates should align reporting dates and refresh exposure and fees as well as yields. A past rate pattern or displayed income measure should never be relabeled a guaranteed future return.




Comments