
You are bullish on semiconductors, so you buy a semiconductor ETF. Then Nvidia reports strong demand, or memory prices rise, and you expect your fund to benefit in the same way. That assumption can hide a surprisingly different portfolio.
SOXL, SOXX and SMH are not interchangeable expressions of one idea. Benchmark selection, company weights and leverage determine which parts of the industry drive the result. For investors following HBM, that distinction matters as much as the sector label.
Sources checked October 24, 2026. SMH means the US-listed fund. The holdings comparison uses October 22; the three-product worked example uses September 30. The two dates are kept separate.
SOXL vs SOXX vs SMH: benchmarks before performance
| ETF | Benchmark | Objective or structure |
|---|---|---|
| SOXL | NYSE Semiconductor Index | Seeks +3x the benchmark’s daily return |
| SOXX | NYSE Semiconductor Index | Conventional index-tracking ETF |
| SMH | MVIS US Listed Semiconductor 25 Index | Conventional ETF tracking a different index |
Sources are the Direxion, iShares and VanEck product disclosures. SOXL and SOXX reference the same index, but costs, instruments and execution differ. Three times SOXX’s realized daily price return is not a guarantee of SOXL’s return.
Nor is every “semiconductor index” the PHLX Semiconductor Sector Index, often called SOX in market coverage. The NYSE benchmark is a distinct index. An old benchmark description can undermine an otherwise careful comparison.
Nvidia, TSMC and memory holdings on the same date
The following comparison aligns iShares’ official holdings CSV and VanEck’s holdings at October 22, 2026. Values are percentages of each fund’s net assets, not percentages of semiconductor-industry revenue.
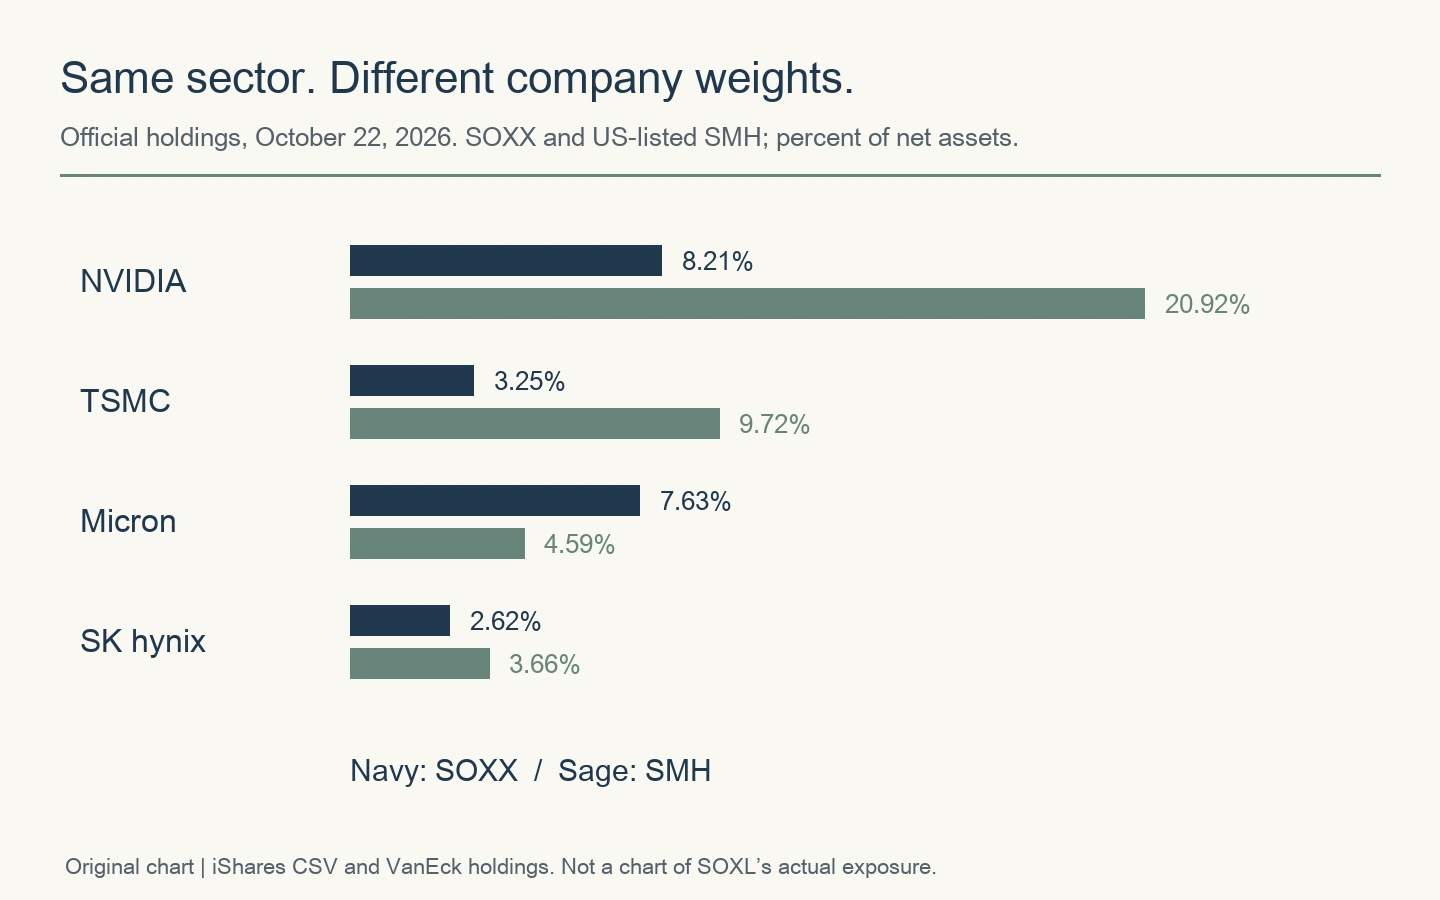
| Company | SOXX | US-listed SMH |
|---|---|---|
| Nvidia | 8.21% | 20.92% |
| TSMC | 3.25% | 9.72% |
| Micron | 7.63% | 4.59% |
| SK hynix | 2.62% | 3.66% |
At this observation, SMH has larger weights in Nvidia and TSMC, while SOXX has a larger Micron weight. “Which fund benefits from AI?” is therefore too broad to answer the portfolio question.
A memory-company allocation is not an HBM revenue allocation
Adding just Micron and SK hynix gives 10.25% for SOXX and 8.25% for SMH. That is an original sum of two named holdings. It is not a complete memory-related exposure measure and certainly not a direct measure of exposure to HBM sales.
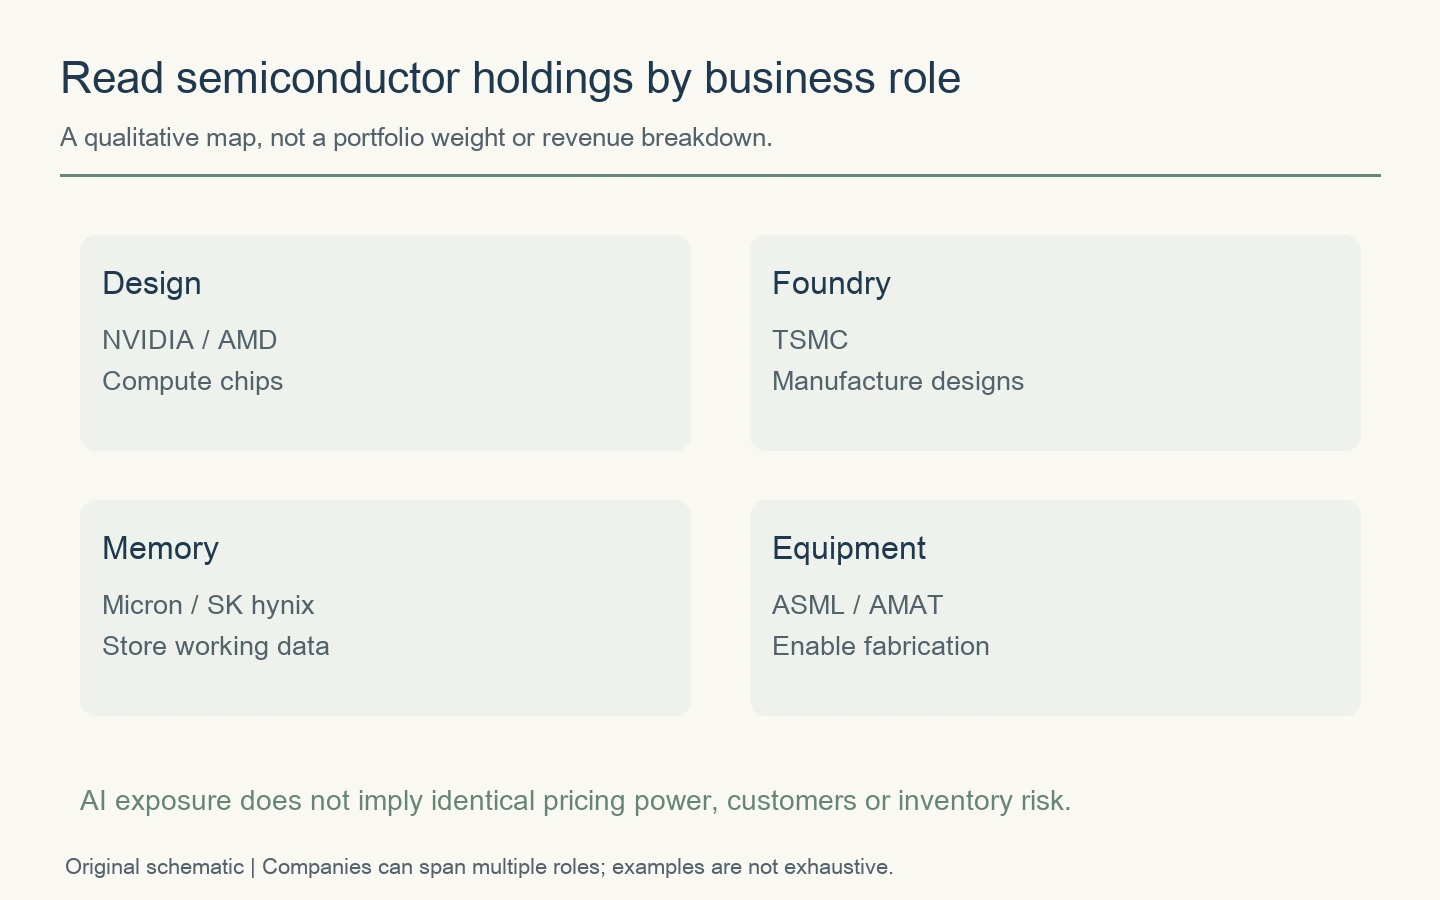
A company can sell HBM, conventional DRAM and NAND. Equipment suppliers can benefit from memory investment without being memory manufacturers. Corporate margins and the valuation paid for the shares also matter. Our memory-industry map separates those business models.
Advertisement
Why SOXL’s collateral holdings are not its semiconductor exposure
A leveraged fund’s holdings may include cash, short-term government securities and derivatives. Reading only the market value of its physical shares can make it look unlike the semiconductor exposure you expected.
But collateral and economic exposure answer different questions. Derivative reference assets and notional amounts help identify which market movements the fund is exposed to. Multiplying a cash-collateral list by three does not recover the underlying company weights.
Below we use the benchmark and daily target for an explicitly simplified approximation. We do not label it an exact map of SOXL’s current positions. Distinguishing a model from observed holdings is more useful than producing an apparently precise number from incompatible columns.
The same $10,000 can create different Nvidia sensitivity
For a three-product example, align the source dates at September 30, 2026. Nvidia represents 7.40% of SOXL’s target index, 7.39% of SOXX and 19.37% of SMH. Do not substitute October weights into part of this calculation.
SOXL’s approximate Nvidia exposure: $10,000 × 3 × 7.40% = $2,220.
SOXX: $739. SMH: $1,937.
The SOXL figure is a one-day sensitivity approximation, not directly owned Nvidia stock.
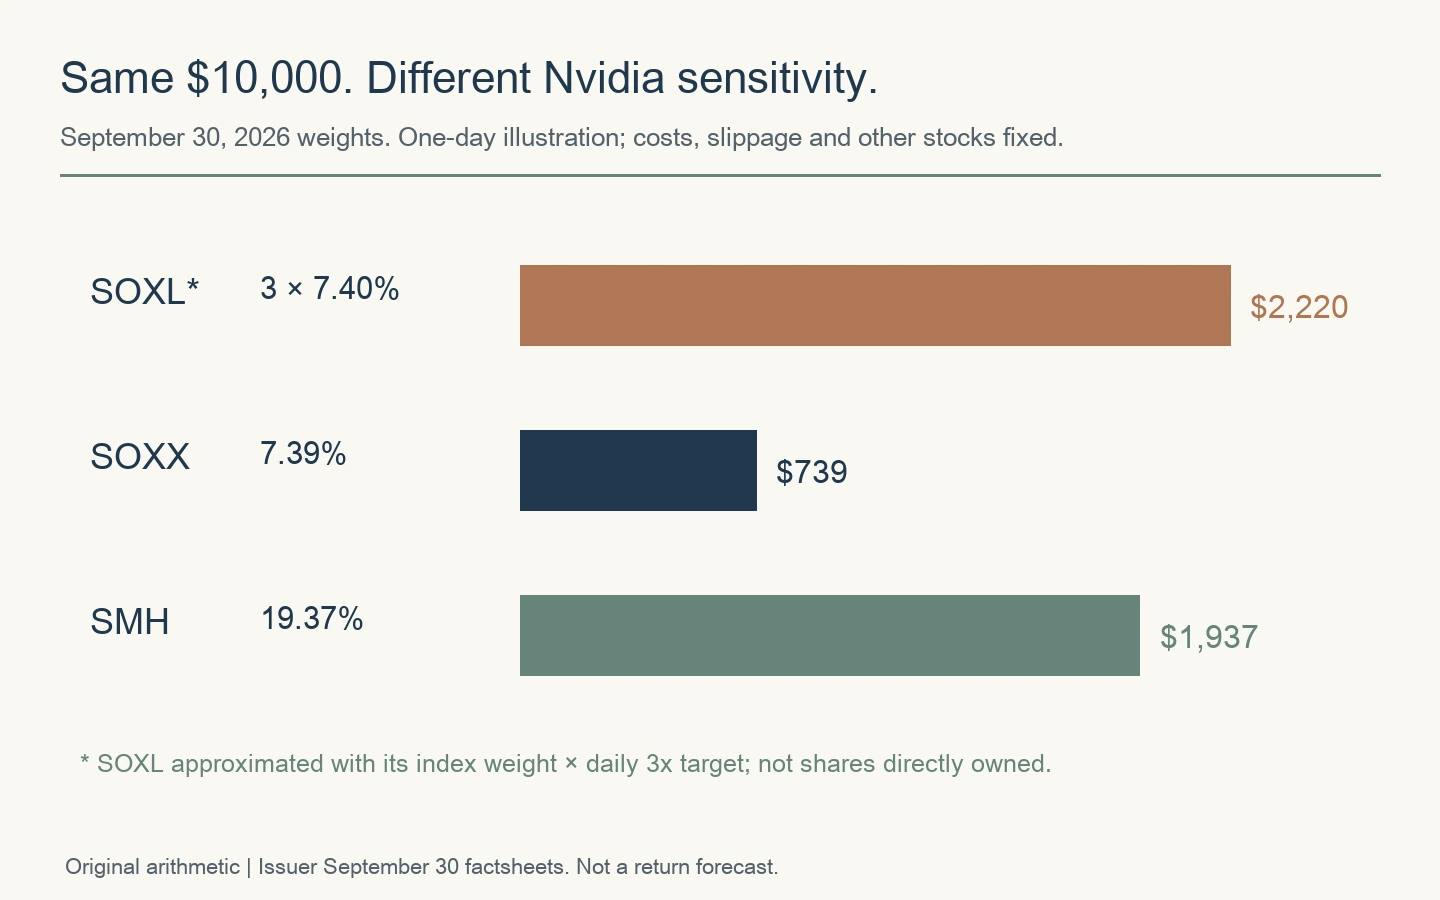
If Nvidia alone rises 1% and every other constituent is unchanged, the implied impact is approximately $22.20, $7.39 and $19.37, respectively, under those assumptions. Larger is not automatically better. It means the same invested amount has different sensitivity to one company.
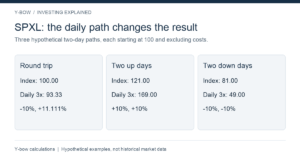
Balances and index weights change. Holding one-third as much SOXL does not automatically reproduce SOXX or SMH over time: daily rebalancing, financing, the path of returns and the treatment of uninvested cash still matter. Our SOXL guide addresses the daily-leverage mechanism in detail.
Weight caps do not freeze a portfolio forever
Index rules govern eligibility, selection, rebalancing and concentration. The September 2026 MVSMH guide, for example, includes a 20% maximum for a single security within its large-weight group at the relevant adjustment. Its group-allocation and redistribution rules are more involved than simply putting a 20% cap on every market-cap weight.
Prices can subsequently move weights above a reset level. Nvidia’s 20.92% SMH weight on October 22 is not, by itself, evidence of a rule breach. Read when a limit applies. And do not import an old cap from another index into a current SOXX comparison.
Rebalancing can also change your investment thesis without changing the ETF ticker. A fund remains a convenient vehicle, but the businesses and weights inside it deserve periodic review.
Start with the business you expect to benefit
Write down the mechanism behind your semiconductor view. More GPU compute? Better HBM pricing? A new wave of fabrication equipment orders? Then identify the companies exposed to that mechanism and the fund’s allocation to them.
Finally, include your other investments. Nvidia shares, a Nasdaq-100 fund and a semiconductor ETF can all concentrate the same company risk. Three tickers are not necessarily three independent sources of return.
US-listed SMH and UCITS products need separate identification
For international readers, confirm exchange, domicile and ISIN as well as ticker. A VanEck UCITS semiconductor product is not automatically the US-listed fund analyzed here. Availability and local regulation are separate from the economic comparison.
If comparing returns, align dates, distribution reinvestment, split adjustment and currency. Do not compare a dollar total return for one ETF with a local-currency price return for another. Execution is another layer: our ETF order and spread guide covers that question.
Sources, methodology and updates
The four-company comparison uses official October 22 iShares and VanEck holdings. The Nvidia worked example separately uses September 30 issuer factsheets from Direxion, iShares and VanEck. The memory sum includes only the two named holdings. SOXL’s illustrative sensitivity assumes exact daily benchmark leverage and omits costs and tracking differences.
All three diagrams are original. The source date stays next to the measurement; index changes or new holdings require an updated observation. This comparison explains exposure rather than recommending which fund to buy.


Comments