
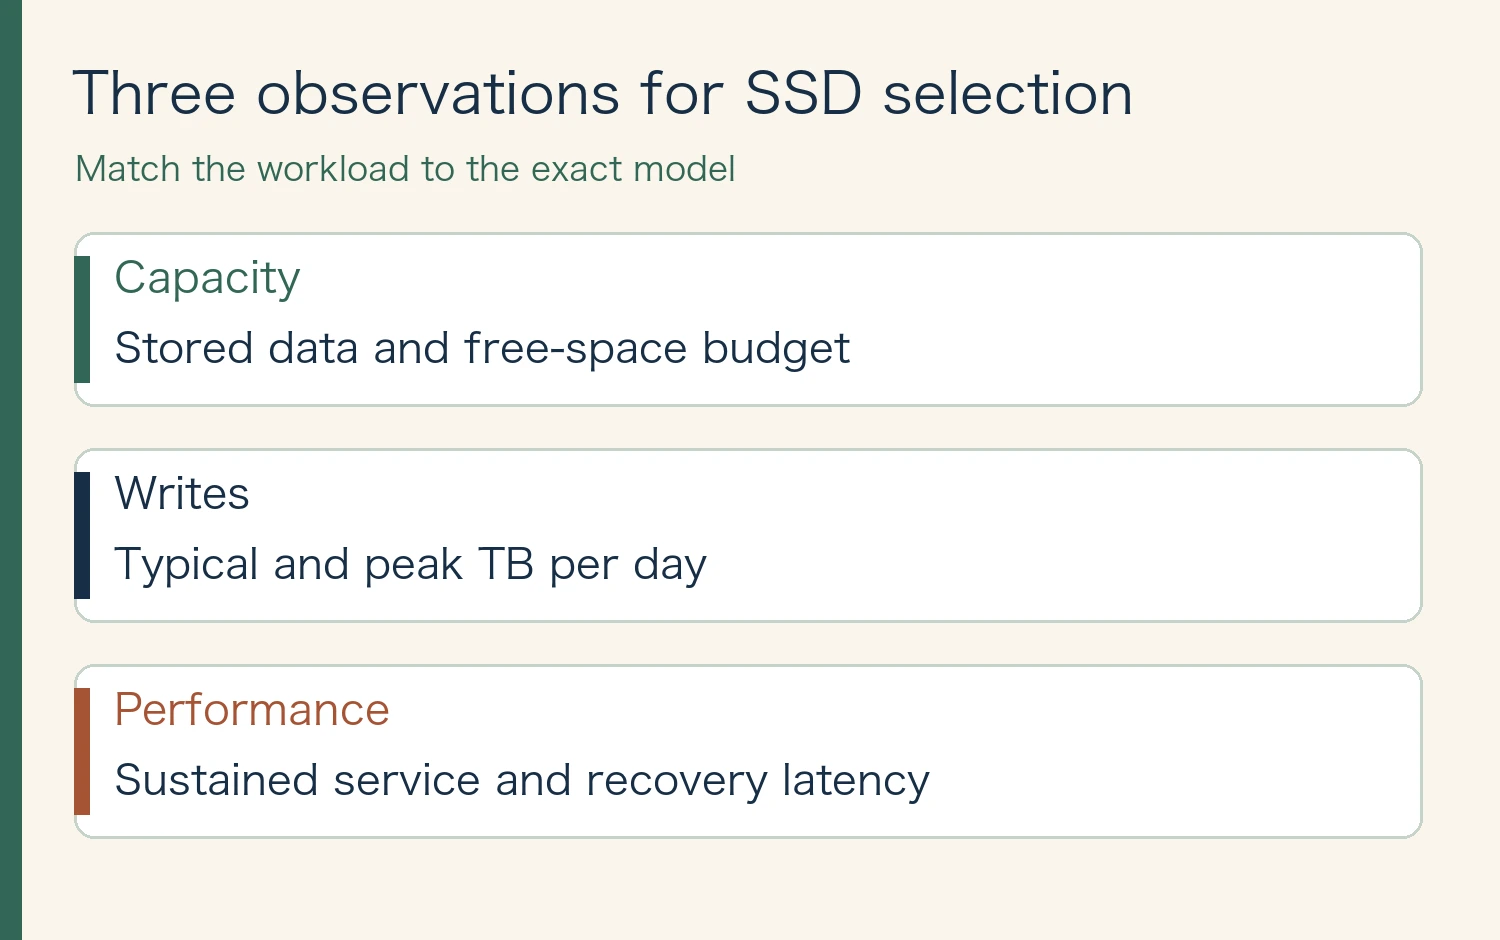
A high-capacity SSD can be an excellent place to serve data and a poor place to rewrite it continuously. The first two questions are how many terabytes the workload needs to store and how many it writes each day. A data lake that mostly serves reads and a scratch volume that rebuilds frequently can need different drives in the same rack.
In October, Kioxia announced its QLC LD4 series for hyperscale data centers. The announcement lists 15.36 TB and 30.72 TB and describes a validated architecture that can support up to 122.88 TB. At announcement the drives were sampling to select customers. Keep the tested design ceiling, available samples and final production specifications in separate columns.
How QLC and TLC store information
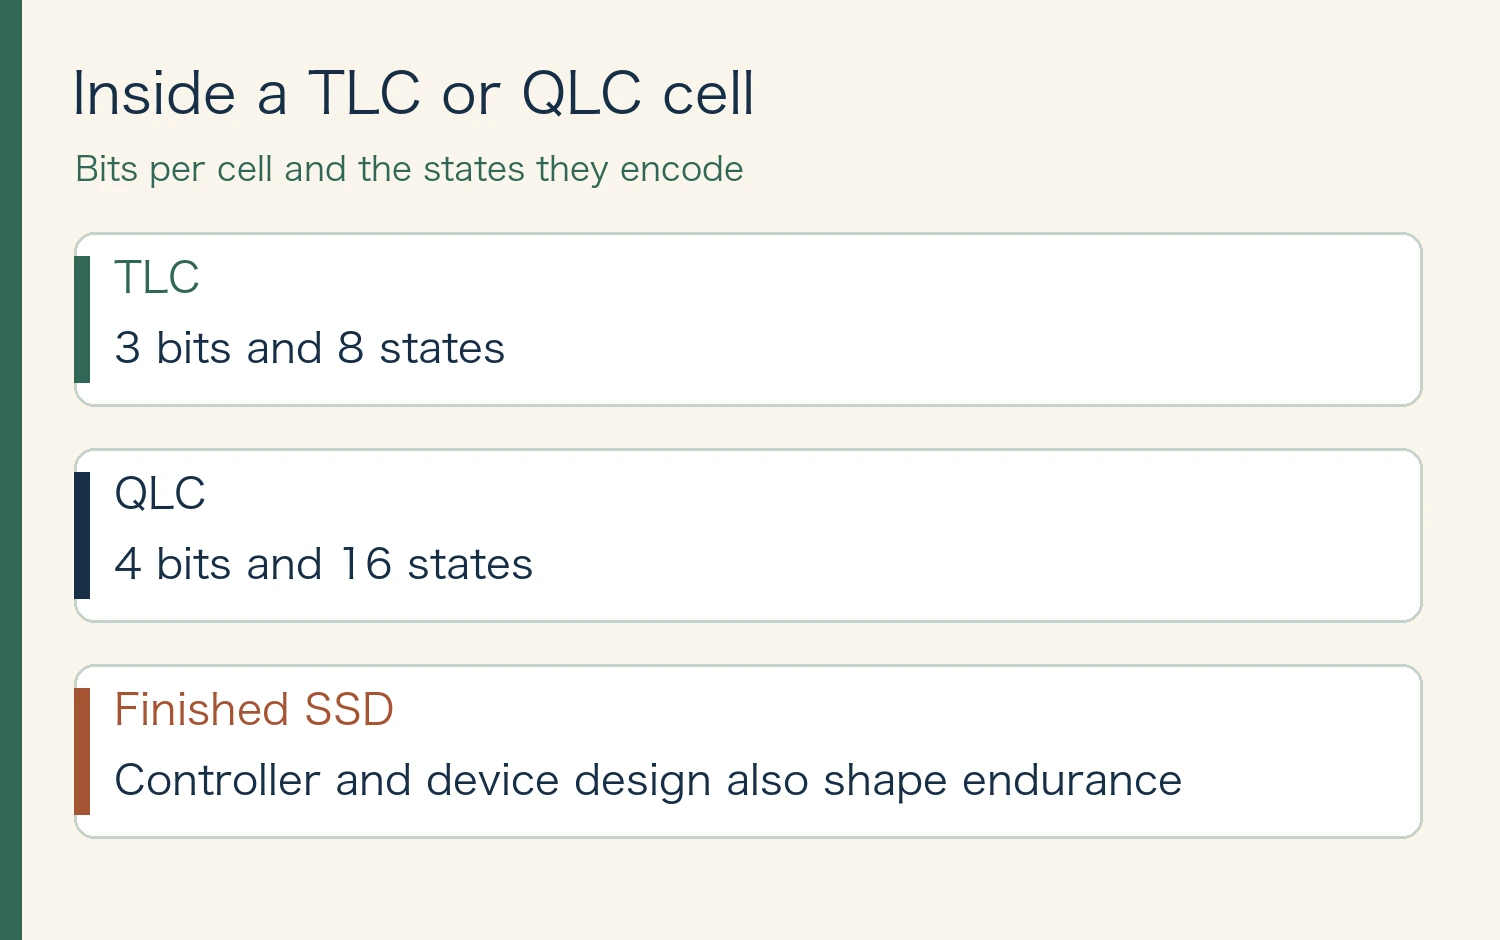
TLC stores three bits per cell and distinguishes eight states. QLC stores four bits and distinguishes sixteen. Extra bits can increase density, but the device must distinguish more states as cells wear. This is a reason to check endurance. It does not tell you the usable life, sustained throughput or latency of a finished drive.
Controller design, error correction, spare capacity and firmware all matter. So does the workload the vendor used for the rating. An interface label such as PCIe or NVMe tells you how the host talks to the drive, not how a particular drive will behave after sustained writes.
Advertisement
Convert DWPD into the write budget you actually need
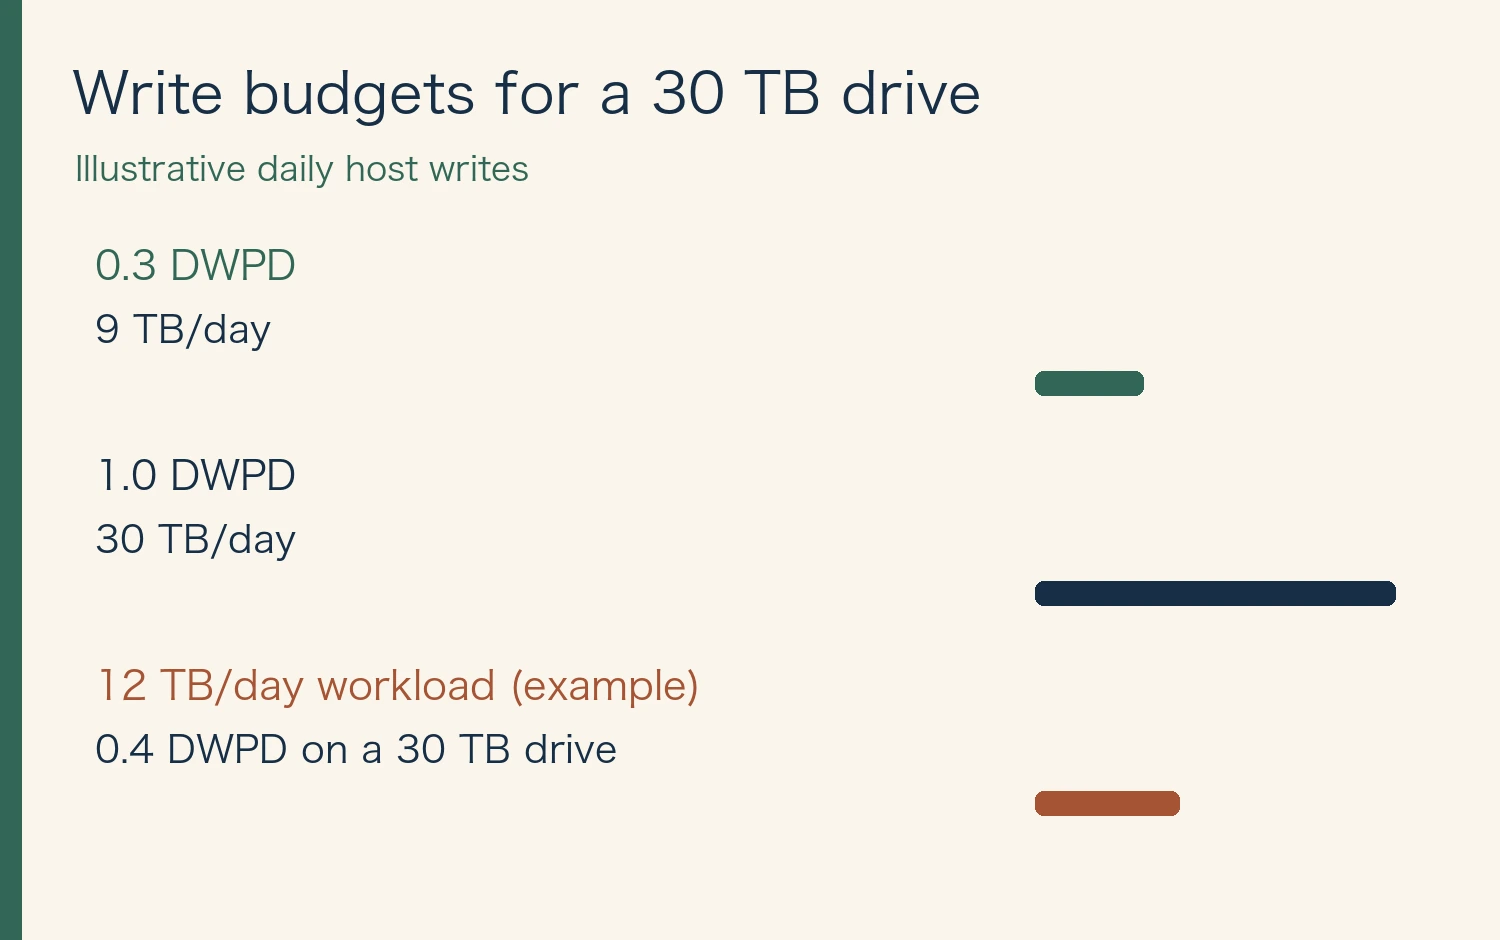
Drive writes per day, or DWPD, expresses rated writes relative to drive capacity. Total bytes written, or TBW when reported in terabytes, expresses a cumulative amount. For an illustrative 30 TB drive, 0.3 DWPD is 9 TB per day. One DWPD is 30 TB per day. Over five 365-day years those simple conversions are 16,425 TB and 54,750 TB, respectively. Use the published warranty and endurance conditions for a real purchase.
Turn the calculation around for a workload. Twelve terabytes of host writes per day on 30 TB of capacity is 0.4 DWPD. It exceeds the 0.3 rating in this example. Doubling capacity at the same DWPD doubles the calculated terabytes per day, so ranking drives by DWPD alone may hide the useful comparison.
Separate the read path from the write path
Serving model files, static datasets or media may be read-heavy. Checkpoint writes, index rebuilding and cache churn can produce spikes. Measure daily host writes, peak intervals and tail latency after the workload has been running long enough to expose sustained behavior. In a shared service, capture a rebuild or a busy interval as well as a quiet daily average.
Host writes and writes to the NAND are different measurements. Internal movement and reclamation can amplify writes. Vendor ratings may depend on random versus sequential access, block size and other test conditions. Compare the stated workload and warranty period before comparing two headline numbers.
← Swipe to view the full table →
| Item | What to verify |
|---|---|
| Capacity | Stored data and free-space budget |
| Writes | Typical and peak TB per day |
| Performance | Sustained service and recovery latency |
Advertisement
Use the exact model and capacity in the data sheet
Check sustained write speed, mixed-workload latency, capacity, form factor, power and power-loss protection in addition to endurance. Keep the vendor’s documentation date and model number. An endurance figure for one QLC family cannot fill a blank in the LD4 announcement. Update the comparison when a final production specification is available.
Can QLC be a good fit for AI storage?
It can be a candidate where the workload is read-heavy and measured writes and latency fit the rated conditions. Start with the write budget and recovery behavior of the actual workload, then compare drives at the same warranty period and test conditions.
Related reading: Memory industry map
Related video (8:47): HBM, DRAM, NAND and the memory supply chain
Sources and review date
Sources reviewed November 12, 2026. Figures and the cover were created for this article. Dated disclosures and illustrative examples are labeled in the figures.








Comments