
A rising market can look gentle on one chart and explosive on another. Before deciding that a price has become a bubble, inspect the vertical axis. A linear scale compares absolute changes; a logarithmic scale compares ratios. Neither display can establish whether an investment is fairly valued.
This English adaptation of Y-bow’s S&P 500 chart article uses invented numbers instead of copying a market-data chart. The aim is to separate a mathematical display choice from a forecast about future stock returns.
The same four numbers, two different pictures
Our example has four equally spaced observations: 100, 200, 400 and 800. Each step doubles the value, a gain of 100%. The absolute increments are 100, 200 and 400. On a linear axis, the later steps are therefore taller. On a base-2 logarithmic axis, the values occupy positions 0, 1, 2 and 3 relative to the starting value of 100. Equal ratios produce equal vertical distances.
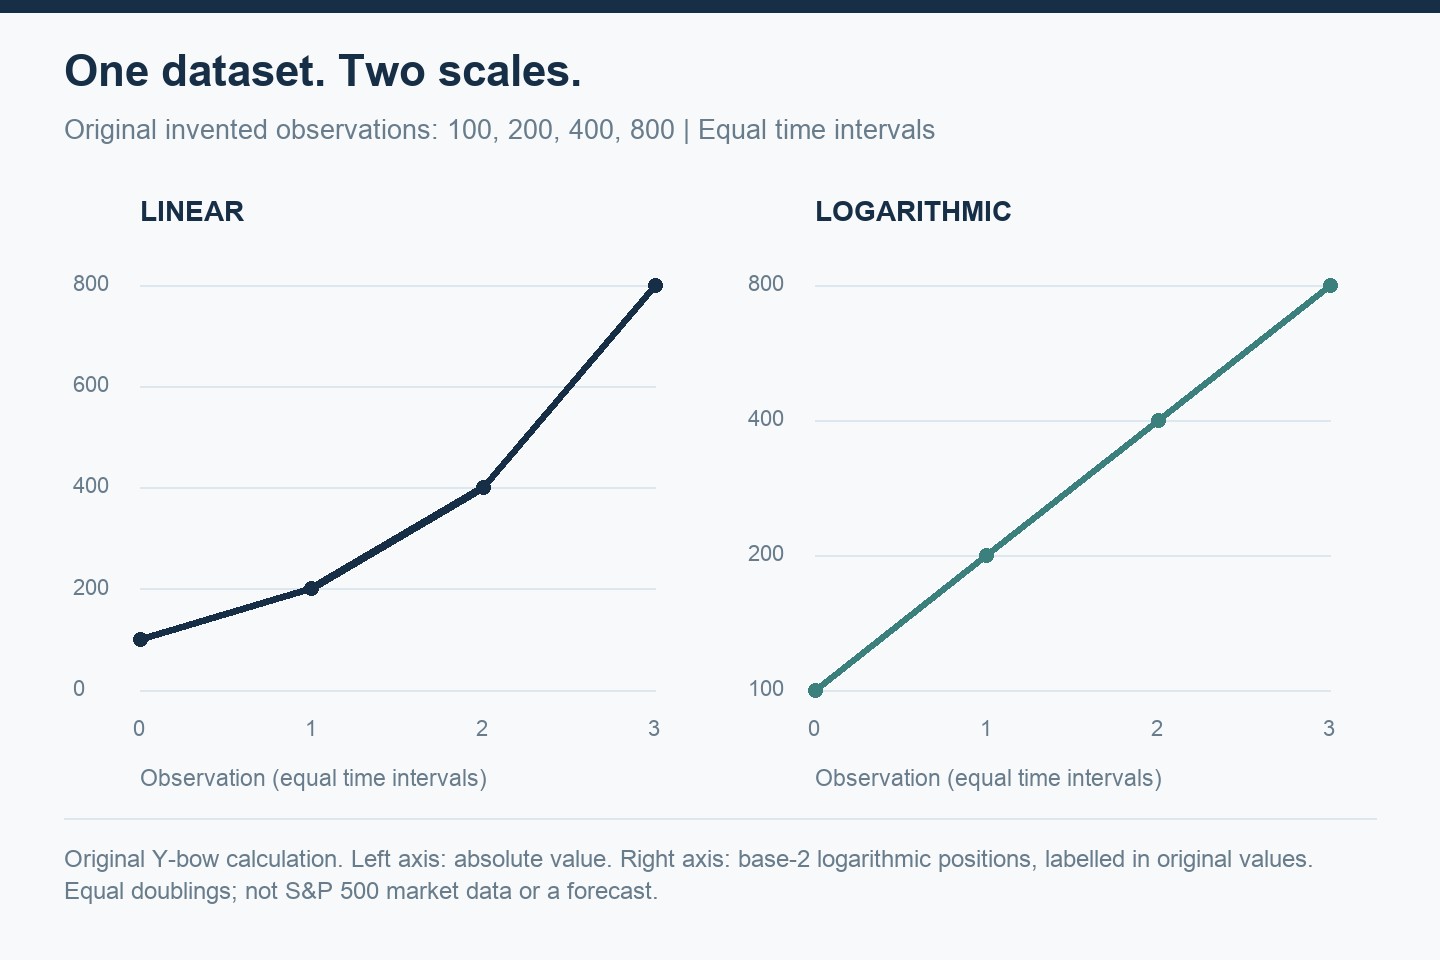
The formula for a plotted position can be written as log(P/100), where P is a positive price. The logarithm rules explained by OpenStax show why subtracting logs expresses a ratio: log(P2) − log(P1) = log(P2/P1). A doubling has the same log distance whether the starting value is 100 or 10,000.
Percentage change and log distance are related, not identical
A 10% rise multiplies a value by 1.10. A 100% rise multiplies it by 2. Using natural logs, their distances are about 0.09531 and 0.69315. The latter distance is approximately 7.27 times the former, not ten times. Log charts preserve equal proportional changes; they do not make every percentage-point comparison linear.
Similarly, a 50% decline and a 100% recovery have equal log distances in opposite directions: 100 to 50 is a factor of one-half, while 50 to 100 is a factor of two. Calling both moves “50 points” on a linear chart can hide how different their percentage returns are. See our CAGR explanation for the arithmetic.
A straight line does not prove a sustainable valuation
If positive values grow at a constant proportional rate over equal intervals, their logarithms form a straight line. This is a statement about the supplied numbers. It does not establish what caused the growth, whether earnings kept pace, or whether buyers paid a reasonable price.
Our interpretation is that changing the axis can correct a visual misunderstanding without settling the economic question. A chart may look less dramatic after switching to log scale, while the business, concentration or valuation risk remains. The Vanguard S&P 500 ETF prospectus dated April 28, 2026 describes stock-market risk and the possibility of losses. A smooth-looking historical line cannot remove that risk.
Choose the display for the question
For an absolute cash-flow question, a linear scale may be the clearer choice. In our example the final step adds 400 units, four times the first step’s increase. For comparing growth rates across very different price levels, log scale makes the equal doublings visible. The useful approach is to understand what each view emphasizes.
Ordinary real-valued log scales require positive values. An account balance that reaches zero, or a profit measure that becomes negative, cannot simply be plotted on the same ordinary log axis. Also inspect the time window, currency, dividend treatment and whether the series is a price index or total return. Changing an axis cannot reconcile different underlying datasets.
Read our CAGR guide and backtesting guide before using a chart as evidence for an investment plan. Sources checked October 12, 2026. Original examples and interpretation by Y-bow. Japanese counterpart.





Comments