
An investor can be right that the internet will remain important and still lose money in an internet stock fund. Business growth, the price paid for that growth, and the investment product's mechanics are separate questions. WEBL adds a fourth question: what happens when the exposure is leveraged daily?
The useful way to read this product is from the benchmark outward. Start with the companies and index rules, then examine the leverage, costs and role in your portfolio.
What WEBL is designed to do
Direxion's WEBL seeks 300% of the daily performance of the Dow Jones Internet Composite Index before fees and expenses. The target is daily, and its achievement is not guaranteed. Direxion: WEBL and WEBS.
An internet-themed benchmark is not the same as the Nasdaq-100, the whole technology sector, or a broad U.S. stock index. The word “internet” does not mean that every company benefiting from online activity is included. Verify the current benchmark methodology and holdings instead of treating a theme as a complete list of businesses.
Three questions behind the internet label
An online business may earn money from advertising, subscriptions, marketplace services, infrastructure or transactions. Those revenue models react differently to economic conditions. A company can have growing users and disappointing profits if acquisition costs, competition or capital spending rise faster than revenue.
Then consider valuation. If investors already expect very rapid growth, a good earnings report can still disappoint the market. A compelling business story is not a complete investment thesis unless it also addresses the price and what would undermine the expected cash flow.
| Research question | What to check |
|---|---|
| What drives revenue? | Business segments, pricing and demand |
| Is growth profitable? | Margins, cash flow and capital requirements |
| What is already priced in? | Valuation and the assumptions needed to justify it |
| What does the fund add? | Benchmark concentration, daily leverage and costs |
Daily leverage makes the path decisive
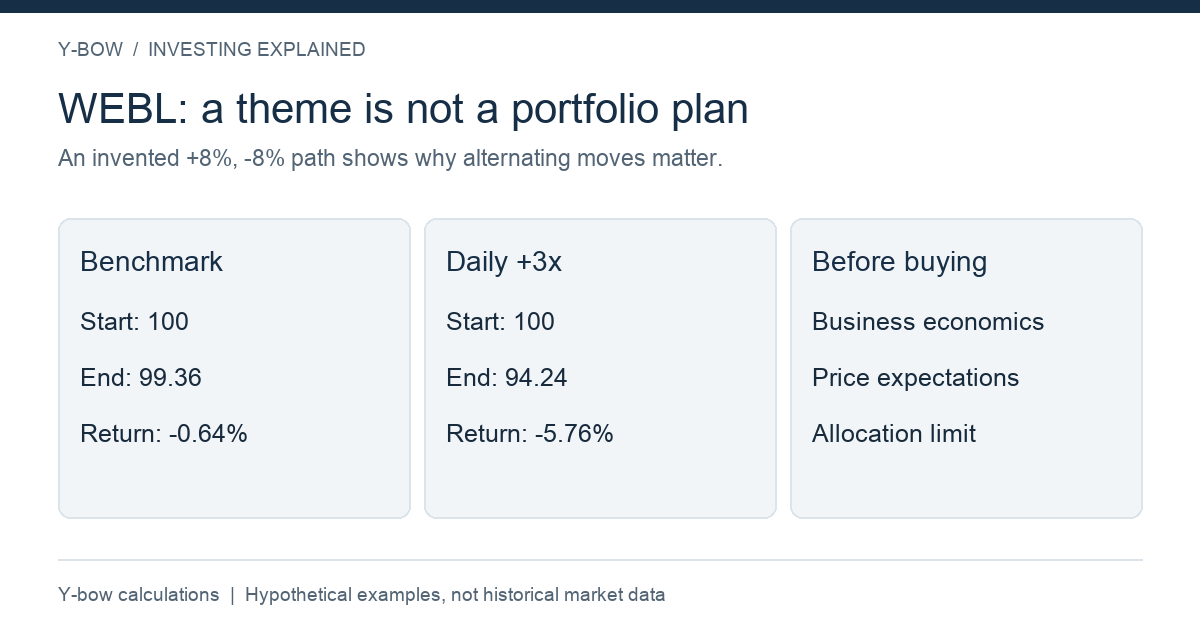
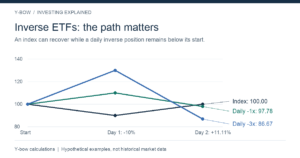
Take a hypothetical index starting at 100, rising 8% and then falling 8%. It finishes at 99.36, down 0.64%. A theoretical +3× daily product moves +24% then −24%, finishing at 94.24, down 5.76%.
Neither number is WEBL's actual return. The example excludes expenses, financing and tracking differences. It shows how alternating moves can damage a leveraged position even when the underlying index seems almost unchanged across the period.
The reverse is also possible: a sustained favorable trend can compound positively. The right conclusion is not that a daily reset predetermines a loss. It is that the entire path matters, making a simple “theme return multiplied by three” forecast unreliable.
A small theme position can dominate a bad day
Suppose 10% of a hypothetical portfolio is in a +3× internet exposure and the rest is in cash. A 5% first-day decline in the benchmark would imply roughly a 15% loss on the leveraged sleeve and a 1.5% loss on the whole portfolio before costs. If the other 90% also holds overlapping internet-related businesses, the overall loss can be larger.
Size the position using the portfolio's combined exposures and a plausible adverse move, not just the amount of cash invested in the ETF. A narrow theme can also change quickly as a few large holdings gain or lose influence.
The checks that remain useful after the next market cycle
Read the current issuer documents for objectives, expenses, derivative risks, holdings and any corporate actions. Use adjusted total-return data when analyzing history. Record the dates and return treatment; a chart mixing different fund histories can produce an attractive but unfair comparison.
Before entering, state the reason for the trade and what would end it. A long-term belief in the internet does not provide an exit rule for a daily leveraged fund. If the money funds an essential near-term goal, that mismatch is especially important.
Continue with daily leverage in TQQQ and the limitations of backtesting. The Japanese WEBL article is the companion discussion.
Objective checked October 14, 2026. Illustrative calculations and diagrams: Y-bow. No actual WEBL return series is represented by the numerical examples.





Comments