
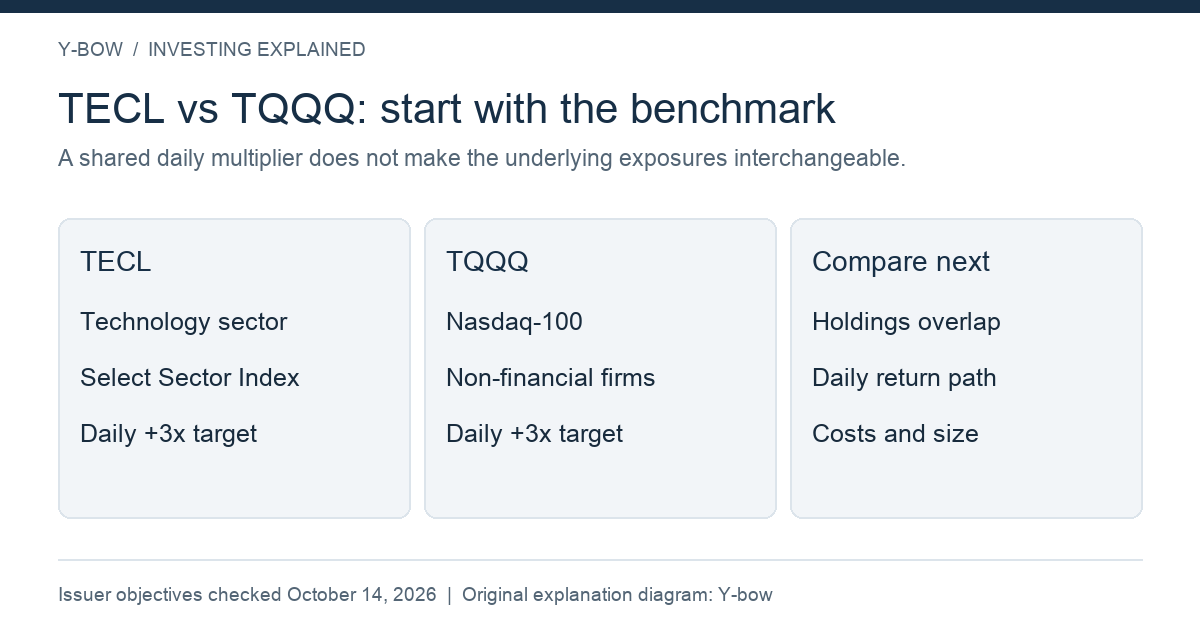
TECL and TQQQ both target three times a benchmark's daily return. That shared multiplier makes them look interchangeable. They are not. A different set of companies goes into each benchmark, so the investment decision starts before the leverage calculation.
If you already hold a broad U.S. equity fund, either product can increase exposure to companies you already own. Adding both may create more overlap rather than more diversification.
What the two products track
TECL targets daily +3× exposure to the Technology Select Sector Index. TQQQ targets daily +3× exposure to the Nasdaq-100. These are the issuer-stated objectives before fees and expenses, with no guarantee of achieving the targets. Direxion: TECL; ProShares: TQQQ.
| Comparison | TECL | TQQQ |
|---|---|---|
| Benchmark | Technology Select Sector Index | Nasdaq-100 |
| Core distinction | A classified technology-sector exposure | Large Nasdaq-listed non-financial companies |
| Daily target | +3× before costs | +3× before costs |
| Multi-day result | Depends on the daily path | Depends on the daily path |
The Nasdaq-100 is not a pure technology index. Sector classifications can place a familiar technology-related business in communication services or consumer discretionary instead. Brand familiarity does not tell you which benchmark includes the company or its current weight.
Equal daily multipliers do not create equal risk
Suppose hypothetical benchmark A rises 2% while benchmark B falls 1% in a day. Idealized +3× implementations would move approximately +6% and −3%, respectively, before costs. The multiplier cannot make the two underlying exposures identical.
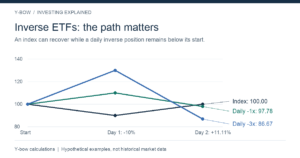
Over multiple days, volatility introduces another difference. Imagine one benchmark gaining 1% on each of two days. It finishes 2.01% higher; its theoretical +3× position gains 6.09%. Another benchmark rises 10% and then falls 7.264%, also finishing 2.01% higher. Its theoretical +3× position finishes approximately 1.67% higher. The same ending index gain produced very different leveraged outcomes.
The latter calculation is 1.30 × (1 − 3 × 0.072636) − 1. These are invented paths, not a backtest of either fund. Their purpose is to show why a terminal index return alone is insufficient.
Measure overlap through the underlying holdings
Do not stop at the number of funds. Download the benchmark or fund holdings with their dates and compare the largest exposures. If a company accounts for 15% of a theoretical benchmark and you allocate 10% of your portfolio to a +3× implementation, the initial benchmark-based notional exposure to that company is roughly 4.5% of your portfolio capital.
That is an exposure estimate, not proof that the ETF owns that exact dollar amount of physical shares. Leveraged funds can obtain exposure through derivatives. Add the exposure to the same company in your other holdings when assessing concentration.
How to compare the costs fairly
Check the latest prospectuses rather than copying an old fee table. Gross and net expense ratios may differ because of temporary waivers; financing-related implementation costs can sit outside a simple headline comparison. Spreads, tracking differences and account-level currency costs also matter.
For performance, align start and end dates, distribution treatment and the return measure. Compare total returns and drawdowns, not just prices per share. A fund that gained more during a growth rally may also produce a less manageable loss for your portfolio in a different environment.
Decide on the exposure before choosing the ticker
First decide whether the intended view concerns the classified technology sector or the Nasdaq-100's broader non-financial universe. Then decide whether daily leverage is appropriate for that view, and how the position will be monitored.
For a long-term financial goal, an unleveraged fund provides a useful baseline. If leverage is added, state an allocation limit and a review rule. “Both are 3×” is a product description, not a portfolio plan.
Continue with TQQQ's daily leverage mechanics and portfolio overlap. The Japanese companion covers the original comparison.
Objectives checked October 14, 2026. Examples and diagrams: Y-bow; hypothetical before-cost calculations, not actual fund returns. Product access and tax treatment depend on jurisdiction.





Comments