
SPXL offers a way to take a much larger daily position in the S&P 500 with a smaller cash outlay. That sounds attractive when the index has been rising. It also makes the phrase “I will hold until it recovers” much less straightforward than it is for an ordinary index fund.
The fund's name tells you the direction and daily multiplier. It does not tell you the return you will receive over a year. Understanding that distinction is the starting point for evaluating SPXL.
What SPXL targets
Direxion states that SPXL seeks 300% of the S&P 500's daily performance before fees and expenses. The issuer also states that achievement of the objective is not guaranteed. SPXL issuer information and prospectus links.
An S&P 500 index fund and SPXL can refer to the same benchmark while doing very different jobs in a portfolio. SPXL adds leverage, derivative exposure and daily rebalancing. The familiar benchmark should not be mistaken for a familiar risk level.
Why a round trip is not a round trip for daily leverage
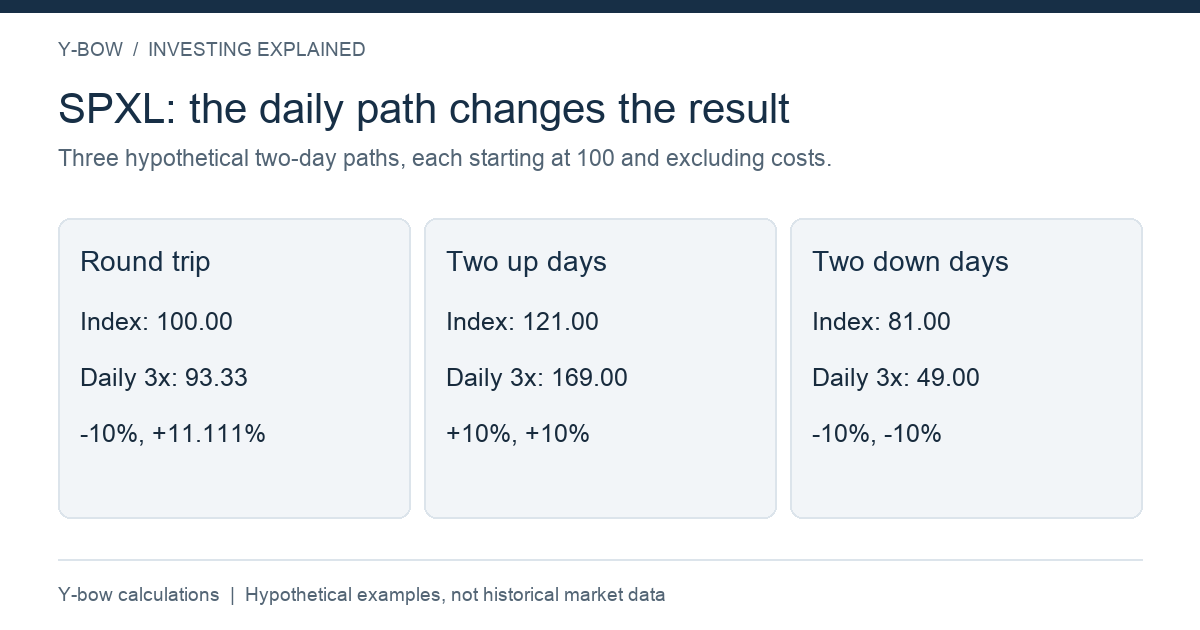
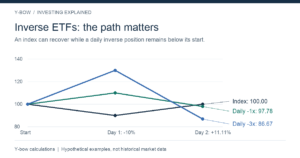
Consider an index falling 10% and then rising 11.111%. Starting from 100, it goes to 90 and back to 100. A hypothetical +3× daily position goes from 100 to 70 and then to 93.33. Its daily targets were met exactly in the example, but it still lost 6.67% over the full period.
| Hypothetical path | Index final value | Daily +3× final value |
|---|---|---|
| −10%, then +11.111% | 100.00 | 93.33 |
| +10%, then +10% | 121.00 | 169.00 |
| −10%, then −10% | 81.00 | 49.00 |
Every row starts at 100 and excludes costs and tracking differences. The strong upward trend compounds favorably; the repeated decline compounds losses; the alternating path creates a different outcome again. This is why “daily reset always loses money” is too simple, but “three times the long-term index return” is wrong too.
A small allocation can be a large exposure
Imagine a portfolio with 80% in an unleveraged S&P 500 fund and 20% in a theoretical daily +3× S&P 500 fund. Its initial equity exposure is approximately 140% of portfolio capital: 80% + 3 × 20%. The leveraged sleeve may look small on the account screen, but its exposure is not.
This approximation applies to small moves around the initial allocation. The values and exposures change as the market moves. A leveraged position inside a cash brokerage account can still create leverage at the portfolio level even if you never borrow personally from the broker.
The costs that a chart can hide
Check the current prospectus for operating expenses, fee waivers, financing-related costs and derivative risks. An expense ratio is useful, but it is not a complete invoice for every implementation cost. Trading spreads and differences between market price and net asset value also affect an investor entering or leaving a position.
When examining past returns, use the same dates and distribution treatment for SPXL and the comparison fund. A reverse split or split changes the price per share and share count; it is not, by itself, an investment gain. Raw prices from different dates can therefore mislead.
Long holding periods need a plan, not a slogan
It is possible for a leveraged fund to have favorable returns over a long period. The question is whether you can fund and manage the position through the unfavorable paths that may occur within that period. A historical recovery does not promise recovery after your purchase.
Write down the allocation limit, the reason for the position, the conditions for review and how a severe loss would affect your financial goals. Money needed for a near-term expense cannot rely on the availability of a convenient future recovery date.
Before comparing SPXL with another leveraged fund
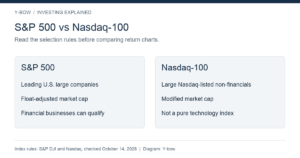
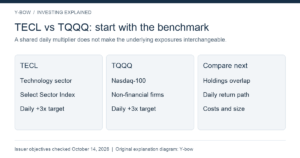
Separate two choices: the underlying exposure and the leverage implementation. A Nasdaq-100 product and SPXL differ in index construction before leverage enters the discussion. Comparing only the best-performing period hides both concentration and path risk.
Continue with our inverse ETF explanation and S&P 500 vs Nasdaq-100. The Japanese SPXL companion covers the original topic.
Product objective checked October 14, 2026. All numerical examples are Y-bow calculations using hypothetical daily returns, not actual SPXL performance. This article explains the product; it is not a recommendation to add leverage.




Comments