

When TQQQ rises, selling some feels like abandoning the upside. When it falls, buying enough to restore the allocation can feel like using up the cash you were keeping for safety. A calendar rule does not resolve that conflict by itself. It only tells you when to act; you still need to decide how much risk and how much cash the account may carry.
This guide uses issuer material checked October 31, 2026 and original hypothetical calculations. None of the model results below is an actual TQQQ backtest, an expected return or a recommended allocation.
TQQQ’s daily reset is not your portfolio rebalance
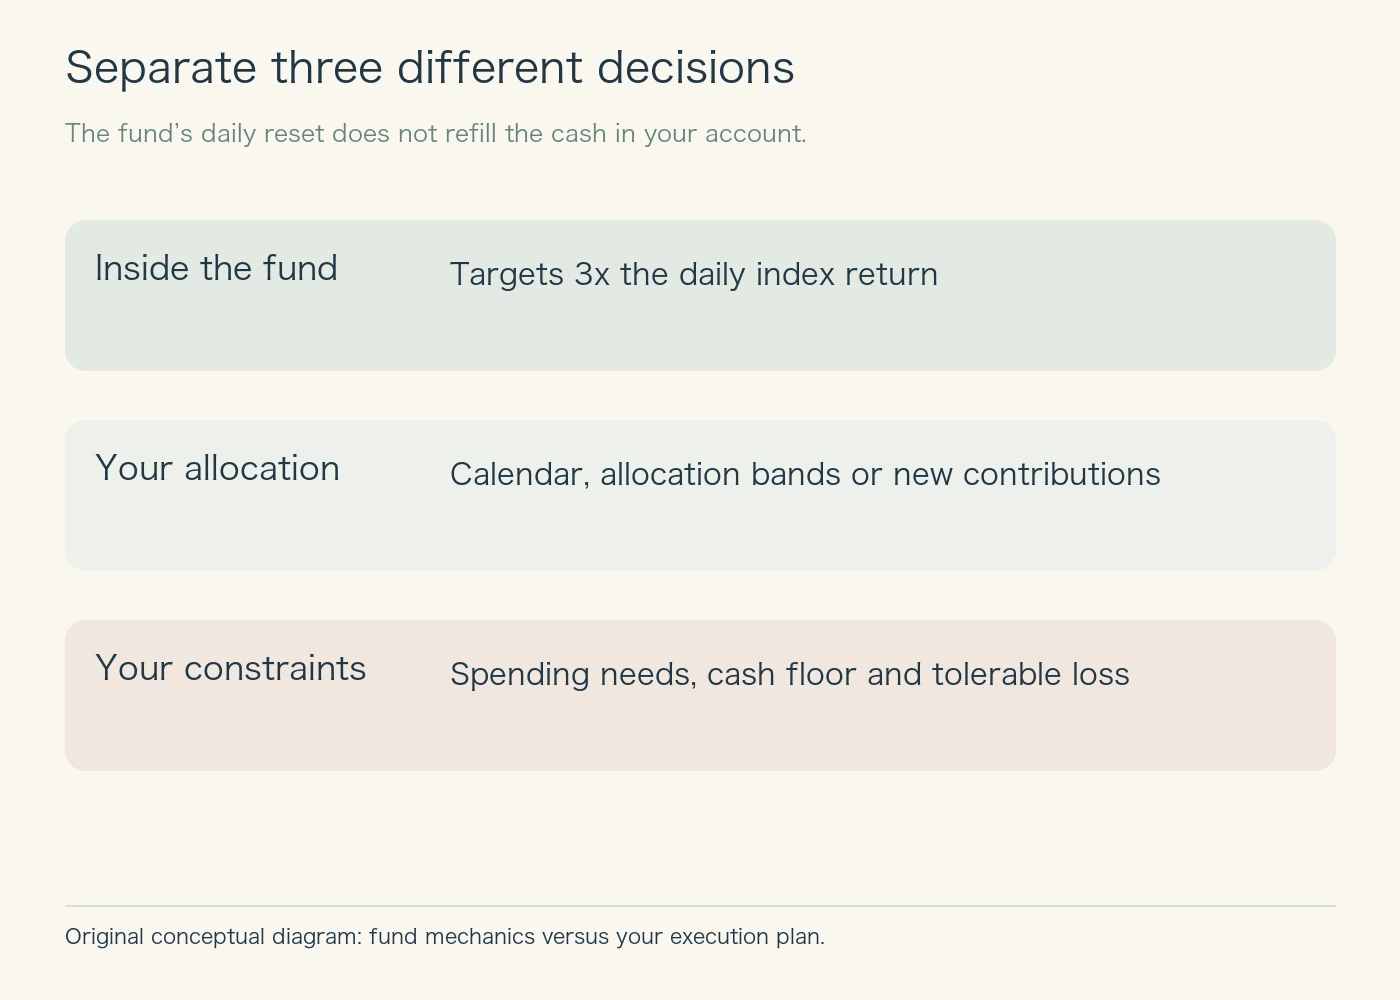
ProShares defines TQQQ’s objective as three times the Nasdaq-100’s daily performance before fees and expenses. Fund-level management of that daily exposure is separate from your decision to maintain, say, half of an account in TQQQ and half in cash. The fund does not replenish your cash balance.
At inception, a 50% allocation implies approximately 1.5 times the account’s value in daily index exposure. After a rally, TQQQ can occupy more of the account and that exposure rises. After a decline, it shrinks. Rebalancing changes the amount of risk you choose to carry; it does not make a multi-day fund return equal to three times a multi-day index return.
Compare calendar rules and allocation bands under the same assumptions
← Swipe to view the full table →
| Rule | Action | Trade-off |
|---|---|---|
| No rebalance | Keep the starting shares and cash | Risk weight can rise substantially |
| Every 21 days | Restore 50/50 at the close | More checks and transactions |
| Every 252 days | Restore 50/50 at the close | More interim allocation drift |
| 40/60 bands | Restore 50% below 40% or above 60% | Can buy repeatedly during a decline |
The bands are ten percentage points around a 50% target, not a relative 10% change in that target. Our calendar labels use simplified 21- and 252-trading-day intervals. A real monthly instruction would need an actual date convention and a rule for holidays.
The model starts with 100 units: 50 cash and 50 in an ideal asset delivering exactly three times each index daily return. It runs for 504 trading days. Each purchase or sale costs 0.1% of the traded amount, deducted from the account. Cash interest is zero. Taxes, fund operating costs, financing and tracking error are excluded. These exclusions matter: the model isolates allocation mechanics, not an achievable return.
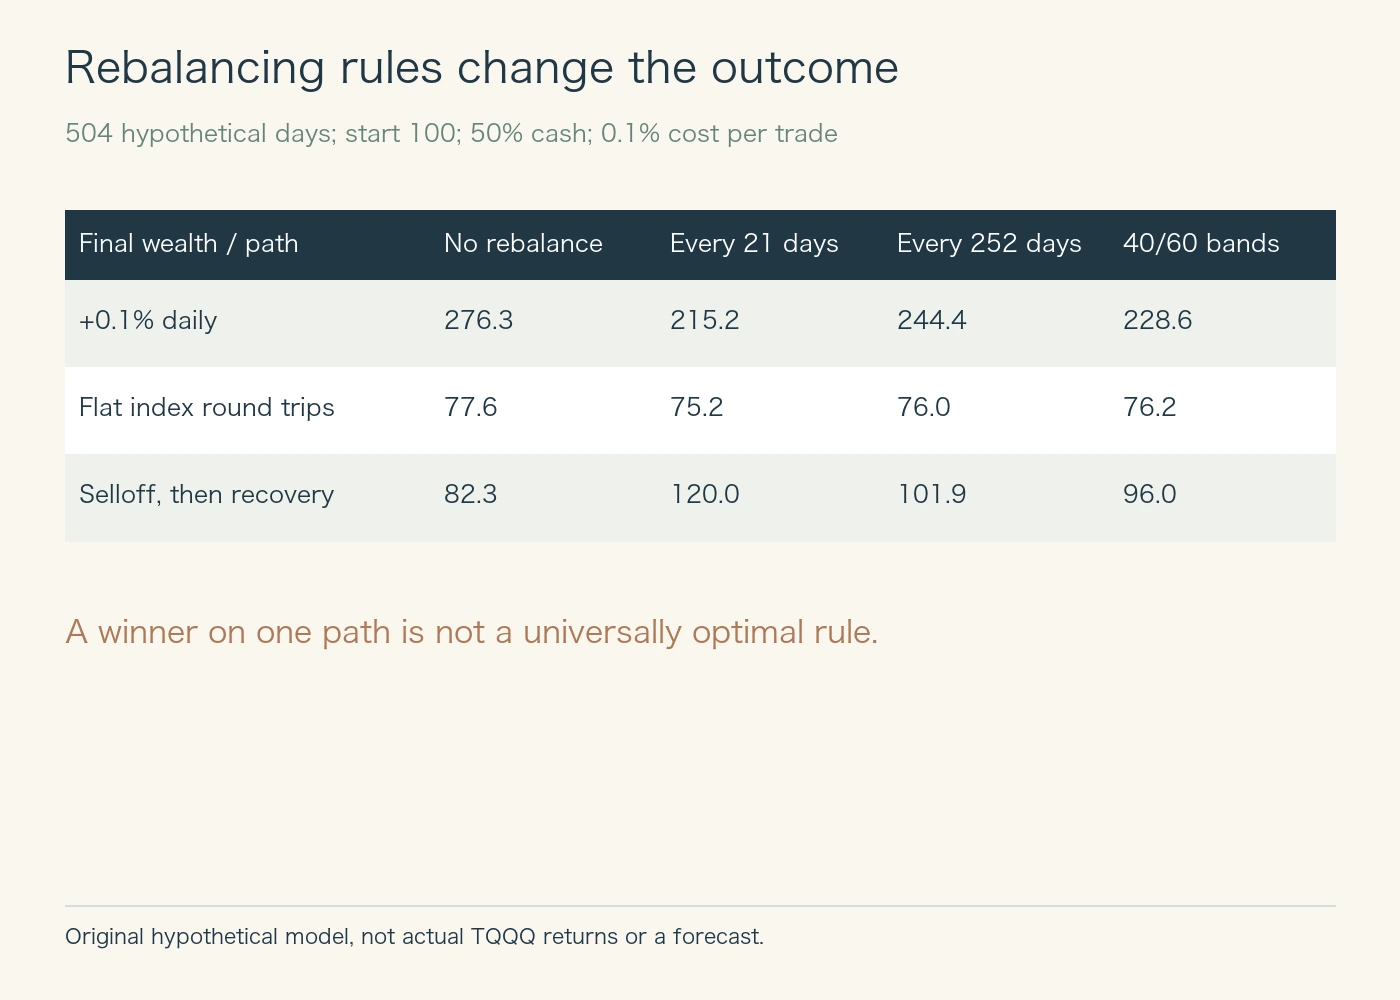
With an index rising 0.1% every day, no rebalancing ends at 276.3 versus 215.2 for the 21-day rule. Selling the appreciating asset reduces participation in the subsequent rise. The higher outcome also comes with greater exposure; it does not establish buy-and-hold as the safer rule.
In a second path, the index alternates +2% and −1.960784…%, returning to the same level every two days. After 252 pairs, no rebalancing ends at 77.6, the 21-day rule at 75.2, the 252-day rule at 76.0 and bands at 76.2. Restoring an allocation does not eliminate the daily leveraged asset’s losses on that path.
Advertisement
Buying during a decline changes both recovery and drawdown
The third path has twenty consecutive index declines of 3%, followed by 484 daily gains of 0.1%. The 21-day rule ends at 120.0, compared with 82.3 for no rebalancing. But the band rule ends at 96.0 and suffers a maximum closing drawdown of about 56.5%, versus 42.4% for the 21-day rule.
Bands bought during the initial decline. Further losses therefore hit newly purchased exposure. A rule can support participation in a later rebound while also worsening the journey into the trough. A final-wealth table without drawdown and cash use is incomplete.
← Swipe to view the full table →
| Rule | Trades | Gross purchases | Minimum cash | Max drawdown |
|---|---|---|---|---|
| No rebalance | 0 | 0.0 | 50.0 | −42.4% |
| Every 21 days | 24 | 21.2 | 28.8 | −42.4% |
| Every 252 days | 2 | 17.4 | 32.6 | −42.4% |
| 40/60 bands | 7 | 28.2 | 21.7 | −56.5% |
Gross purchases include money recycled after sales; they are not the required outside contribution. Counts include the terminal-date rebalance. That last transaction changes the subsequent allocation and incurs a fee, but cannot improve returns already earned during the measured period.
Does rebalancing actually run out of cash?
In an ideal unlevered account holding a positive-valued risky asset and cash, restoring 50/50 leaves a positive cash share after each finite rebalance. Claiming that this automatically reaches zero is inaccurate. Yet if total wealth falls, half of the smaller account may be far less cash in dollars than you need. Fixed-dollar averaging down, withdrawals and borrowing create additional constraints that this ideal rule does not have.
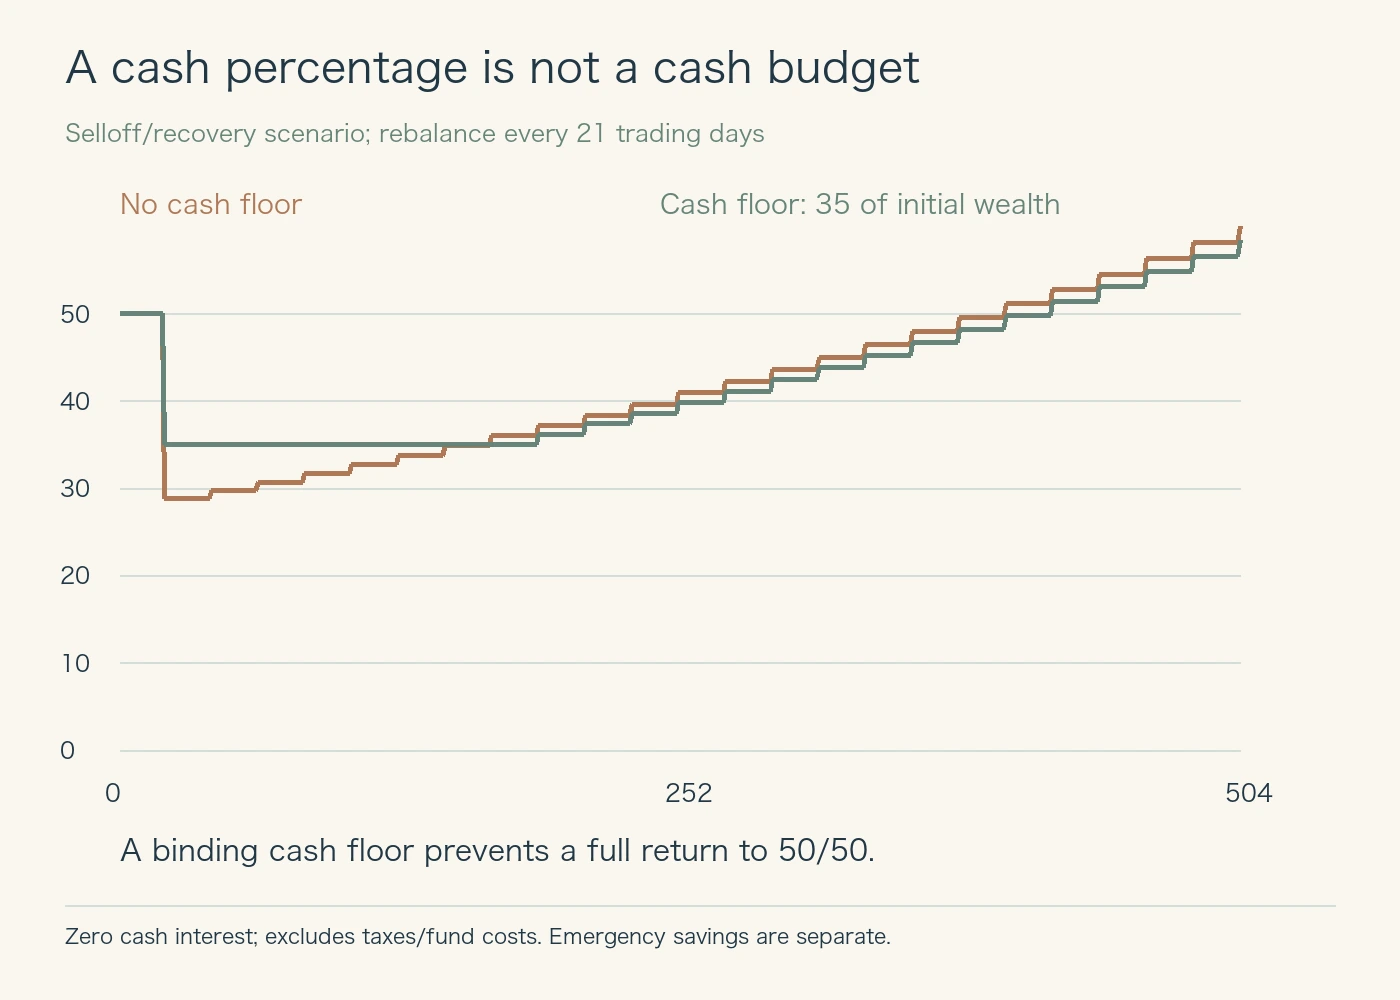
Imposing a 35-unit cash floor prevents a complete return to 50/50 on seven review dates. Final wealth becomes 116.8 and cash never falls below 35.0. The lower final result is not automatically a failure: the rule has a different objective, preserving a cash budget. Neither 35 units nor 50/50 is offered as a suitable personal target.
Keep emergency savings separate from capital earmarked for allocation trades. Decide whether preserving a cash floor takes priority over restoring the target weight. Otherwise, “follow the rule” can mean two incompatible instructions on the same day.
Can new contributions replace sales?
Directing new money to the underweight asset can reduce realized gains and trading. But the required contribution grows with the account. If the risky holding is worth 60 and cash 40, adding 20 cash restores 50/50 without a sale. Adding 10 only reaches 60/110, or 54.5% risky exposure. A fixed contribution cannot always offset a large allocation drift.
In taxable accounts, sales can realize gains, even when commissions are zero. Spreads and tax-lot choices matter as well. Loss offsets and individual tax treatment can alter the result, so the model’s pre-tax ordering is not a personal after-tax ranking. For non-US investors, spending currency and brokerage access add another layer: dollar cash is not a fixed amount of home-currency emergency money.
Related book (affiliate advertisement)
Related background on diversification, costs and disciplined investing. This book is not presented as endorsing our hypothetical allocation rules.
A Random Walk Down Wall Street (English paperback)
View this edition on Amazon Japan
Check the linked page for price and availability. As an Amazon Associate, Y-bow earns from qualifying purchases.
Advertisement
Write an execution plan you can follow in a bad market
← Swipe to view the full table →
| Decision | What to record |
|---|---|
| Target | Fund allocation and approximate account-level exposure |
| Trigger | Calendar or bands; closing-value convention |
| Cash limits | Separate reserves, account floor and contribution ceiling |
| Execution | Costs, taxes, order type and treatment of small trades |
| Review | Changes in spending needs, loss tolerance or ability to follow the plan |
There is no universally optimal frequency in these examples. Choose a rule you can monitor and execute, then review whether it controls the risks you intended to control. Replacing the rule whenever another one wins a recent backtest turns a risk-management process into performance chasing.
Related explanations, sources and reproducibility
Our TQQQ-plus-cash versus QLD guide covers exposure drift; the TQQQ cost guide examines financing and other costs. The English full-length video on SOXL, TQQQ and daily compounding provides background. The free Japanese note with four daily-leverage examples is a supplementary explanation, not the allocation model used here.
ProShares’ rebalancing calculator helps evaluate geared exposure adjustments. It does not certify monthly 50/50 as optimal. Our model multiplies the ideal risky asset by one plus three times the daily index return, then applies the stated close-of-day trades and their costs. Maximum drawdown is the worst decline from an earlier closing account peak. No intraday pricing, actual distributions or historical adjusted NAV series is used.
We will update changed issuer objectives and material cost or tax references. Any future historical test will identify its adjusted data and dates separately. The header is AI-generated conceptual artwork; the three figures are original calculations and diagrams.





Comments