
You park cash in SGOV, then the quoted position value falls near the start of a month. Has a short-term Treasury fund lost money? Or, approaching the same event from the other direction, can you buy just before the distribution and collect an easy extra return?
Both questions require an account ledger, not just a price chart. A distribution can move value out of the fund and create a payment entitlement before cash appears at your broker. That timing can make a position look worse—or a dividend-capture idea look better—than the complete economics justify.
Checked October 25, 2026. This article covers the US-listed iShares 0–3 Month Treasury Bond ETF. Distribution dates below are official history. Accounting and holding-period diagrams are hypothetical, not reconstructed SGOV NAV or performance series.
Why SGOV’s price can fall around an ex-dividend date
iShares describes SGOV as tracking an index of US Treasury bills with maturities of zero to three months, with monthly distributions. Income accumulates within the fund; a distribution moves value to eligible shareholders.
All else equal, NAV decreases by the value distributed when the shares go ex-distribution. The exchange-traded price is not NAV, however. Market conditions, interest rates and the bid/ask can also change. An observed decline need not equal the distribution exactly, and not every decline can be dismissed as a distribution event.
This distinction matters when using a chart. An unadjusted price line omits cash distributions. A total-return series already handles distributions according to its methodology; adding them again would double count. Know which series you are reading before concluding that a pattern offers a repeatable trading edge.
Price, entitlement and cash: a simple SGOV ledger
Take a deliberately invented example: 100 shares at 100.30, with a distribution of 0.30 per share. The position is worth 10,030 before the ex-date. If the only change is the distribution and the price becomes 100.00, the quoted position is worth 10,000.
An entitled holder also has a 30 distribution receivable. The combined economic value remains 10,030 in this no-cost, no-tax, no-other-move example. The payment has not magically created new wealth or erased 30 of wealth.
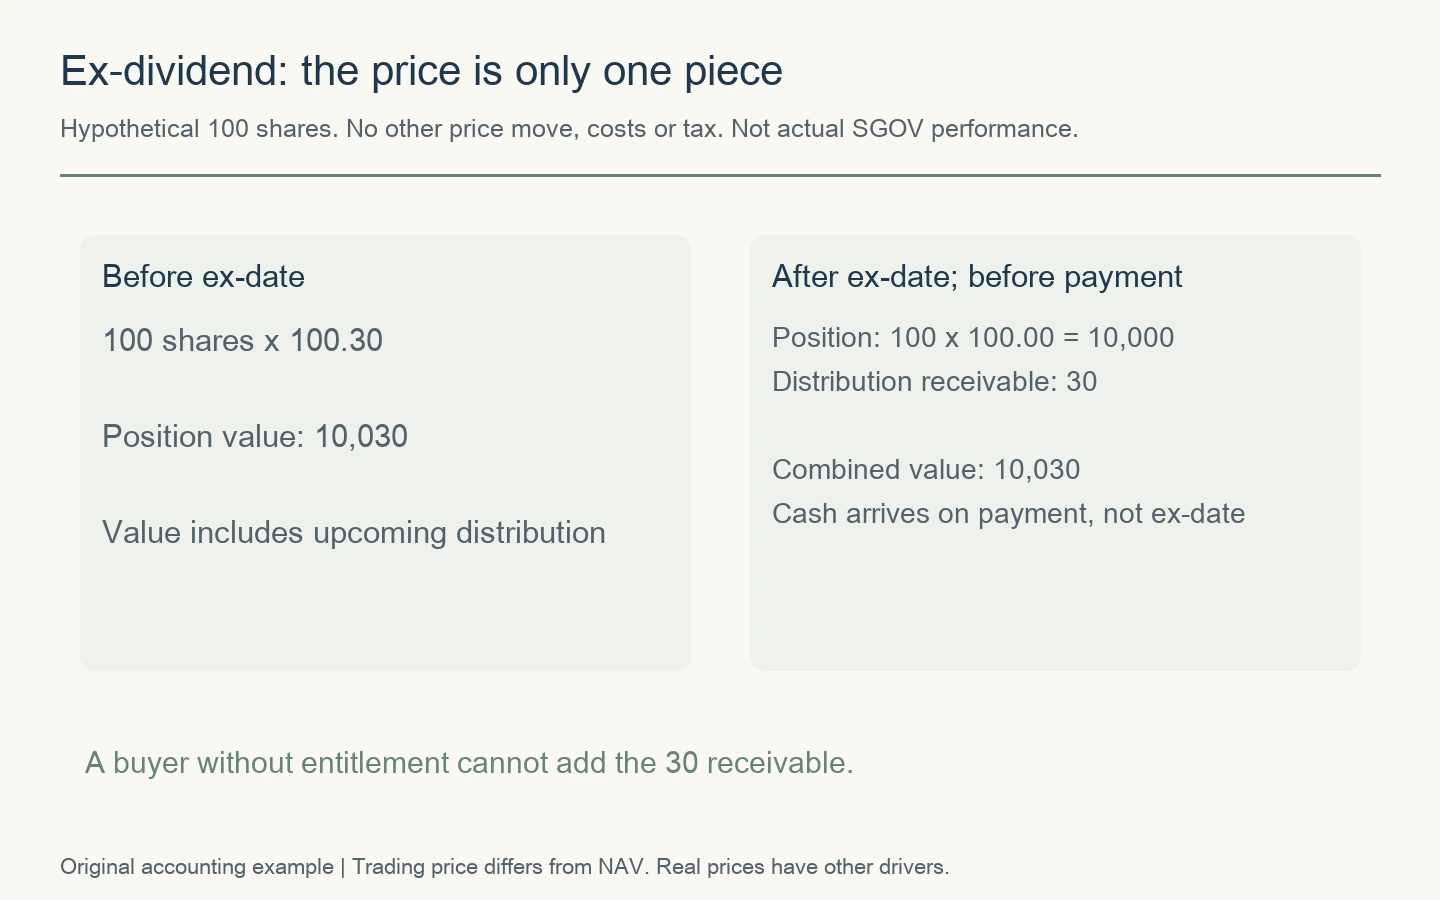
Before payment, a receivable is not spendable cash in the account. Brokers may display the components at different times. A screen that shows only the position can temporarily look like a loss even though a distribution payment is pending.
A buyer without distribution entitlement must not add that same receivable. This is why the investor’s actual trade date and the fund’s announced ex-date matter more than a vague reference to “dividend day.”
SGOV ex-date and payment date are different
The official 2026 history gives concrete examples: August 3 ex-date with August 6 payment, September 1 with September 4, and October 1 with October 6. Per-share amounts also differed.
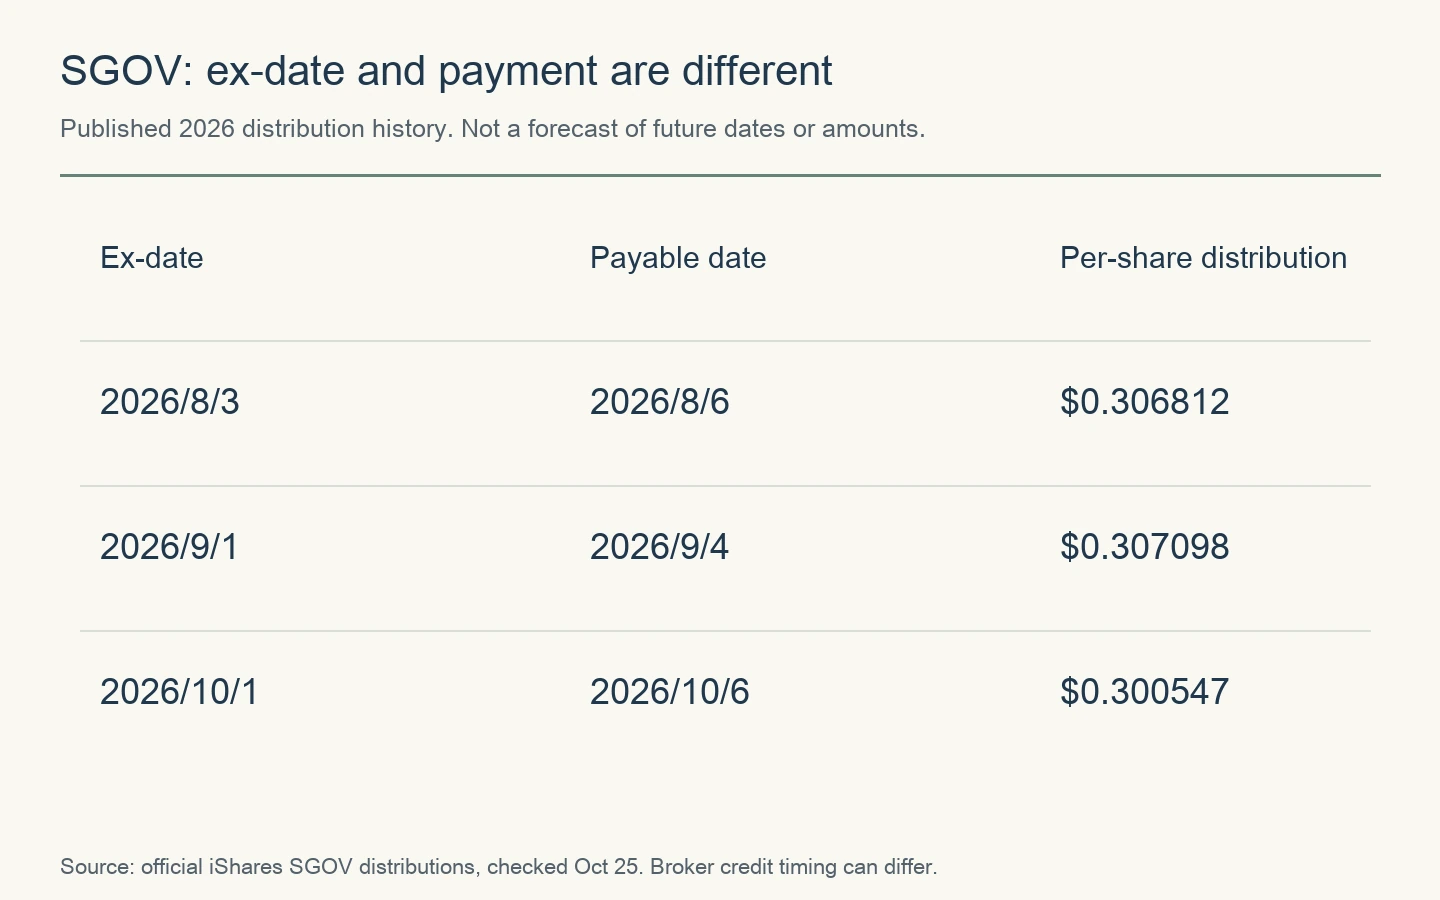
Separate ex-date, record date and payable date when reading a notice. Check the current announcement and your broker’s processing before trading. Do not copy a past month’s calendar into the next month or assume that every broker credits the payment at the same instant.
Is it better to buy SGOV before or after the distribution?
Keep the starting cash equal at 10,030 in the hypothetical example. Investor A buys 100 shares before ex-date at 100.30. Investor B waits in cash, then buys 100 shares at 100 after the distribution-related adjustment, retaining 30 cash.
| Stage | A: buy before ex-date | B: buy after ex-date |
|---|---|---|
| After ex-date | Position 10,000 + receivable 30 | Position 10,000 + cash 30 |
| After payment; unchanged price | Position 10,000 + cash 30 | Position 10,000 + cash 30 |
| Combined value | 10,030 | 10,030 |
A receives the distribution; B retains cash because the same shares cost less. Comparing only the distribution makes A appear ahead while ignoring B’s remaining cash. Once the starting capital and dates are aligned, this simplified example contains no free dividend-capture gain.
Real waiting periods have opportunity costs, price changes and tax consequences. The example does not prove that every purchase date produces the same realized return. It explains why “buy before the dividend” is not a sufficient strategy. Start with when cash becomes available and when it must be used.
Advertisement
Short holding periods: put trading costs into dollars
Assume $10,000 earns a simple annual accrual equivalent of 3.6%, while round-trip trading costs total $10. These are invented inputs, not SGOV’s current yield or typical trading cost.
Using days/365 gives about $0.99 for one day, $6.90 for seven days and $13.81 for fourteen days. Subtract $10 and the respective estimates become −$9.01, −$3.10 and +$3.81. Even a low-volatility asset can be an inefficient temporary parking place if friction is large relative to a very short holding period.
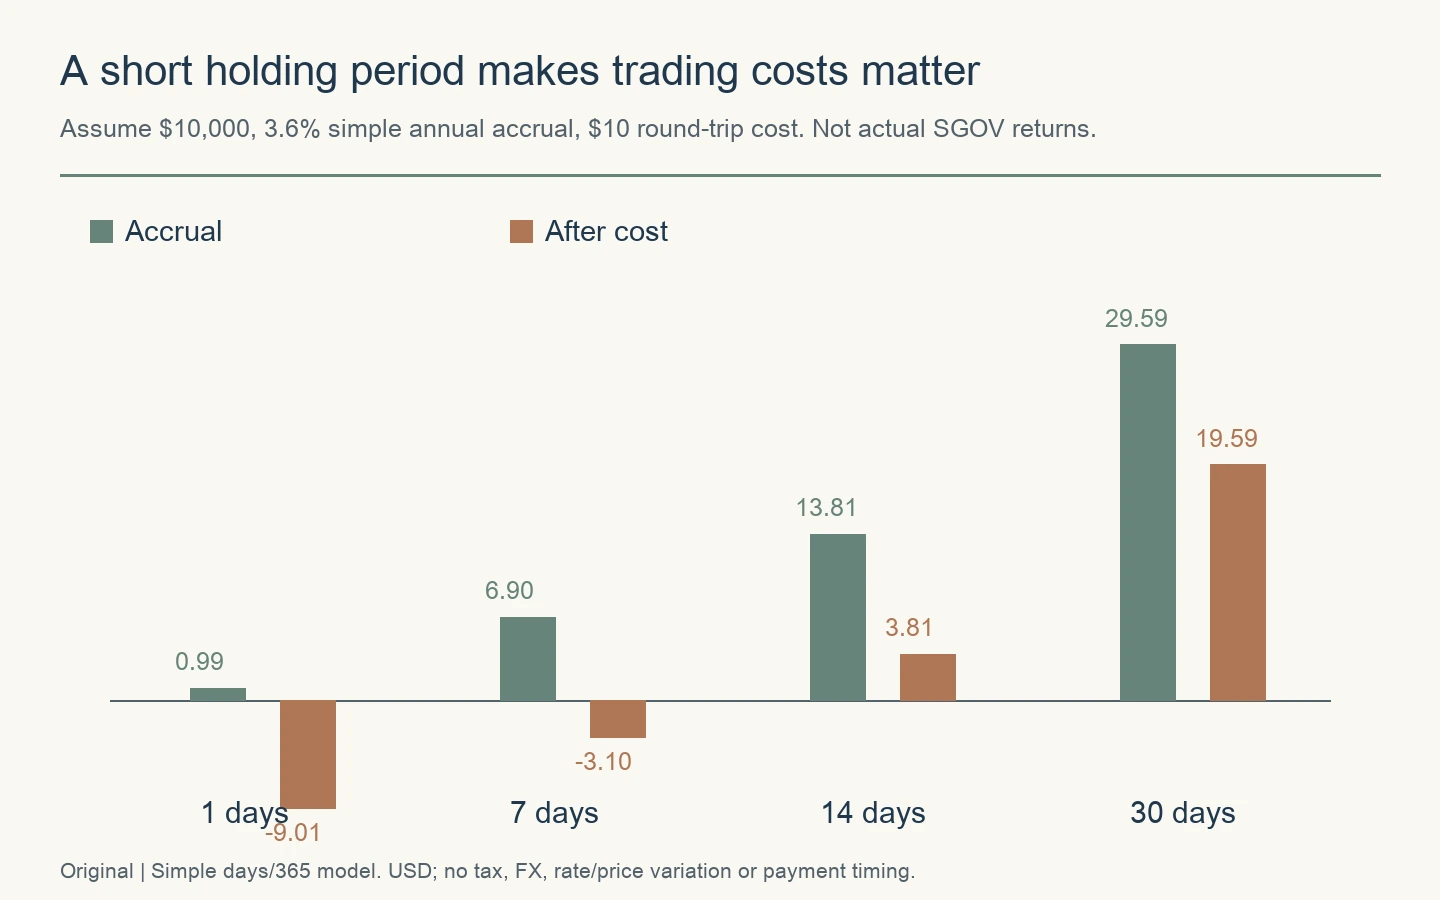
The estimated time for accrual to equal the $10 cost is 10.14 days under those assumptions: cost divided by (capital × annual rate /365). If the cost were $1, it would be about 1.01 days. Neither number is a universal minimum SGOV holding period.
Use your actual spread, commissions and, where relevant, currency conversion costs. Zero commission does not necessarily mean zero friction. The actual executable buy and sell quotes matter; our ETF order and spread guide explains that distinction.
Yield is not a fixed promised rate
A 30-day SEC yield is a standardized measure based on a recent earning period. It need not match a trailing distribution yield or an annualized recent payout. None is a contractual guarantee of what your own next holding period will earn.
SGOV continually holds and replaces short-term securities. A change in short rates can change income. Owning the ETF until a personally chosen sale date is not the same as owning an individual Treasury bill to a specified maturity. Nor is an ETF an FDIC-insured bank deposit.
Be consistent about fees: if a NAV return already reflects fund expenses, do not subtract the expense ratio again. Likewise, an adjusted total-return series cannot be treated as an unadjusted price line with another round of distributions added on top.
Where USFR and spending currency fit
US-listed USFR holds floating-rate Treasury exposure rather than the same short-bill portfolio as SGOV. The rate-reset mechanism differs; two funds paying monthly are not therefore identical. This article does not rank them using unmatched current yields.
Compare the holding period, execution costs, currency and the date funds must become available. Confirm the exchange and legal product, since a similarly named or same-ticker UCITS product is not automatically the US-listed fund.
For non-dollar spending, FX can dominate modest dollar income. If a dollar asset gains 0.3% while the dollar loses 2% against the spending currency, the combined change is 1.003 × 0.98 − 1 = −1.706%. That is a hypothetical currency calculation, not a forecast for SGOV.
| Question | What to establish |
|---|---|
| When is the money needed? | Holding period, sale/settlement and actual cash availability. |
| Which currency is required? | Dollar investment capital versus home-currency spending reserves. |
| What is the friction? | Spread, commissions and conversion costs in dollars. |
| Who receives this distribution? | Your trade date against the current ex-date and payment notice. |
| How is the result measured? | Position, received/pending distributions and remaining cash, counted once. |
The objective is not to discover a calendar trick. It is to keep cash useful while avoiding an accounting mistake, an unnecessary trade or an unintended currency position. Personal tax treatment can change the comparison; an ETF guide should not substitute one country’s tax rules for every reader’s situation.
Sources, assumptions and updates
iShares supplies the SGOV objective, distribution history and risk disclosures; WisdomTree supplies the USFR reference above. Checked October 25, 2026. Distribution dates are historical facts; the other figures are original hypothetical accounting and cost examples, not actual daily NAV series.
The cost chart uses simple days/365 accrual and excludes reinvestment, tax, FX, price/rate changes and payment timing. Future updates should refresh product terms and announced dates while keeping those assumptions visible. An illustrative annual rate must not silently become a current yield or promised interest payment.




Comments