
You check TQQQ’s expense ratio, decide a fee below 1% seems manageable, and then discover discussions about financing costs. Have you overlooked a second bill? And if interest rates fall, does that make holding TQQQ an obvious bargain?
The useful answer starts with separating the layers. Operating expenses, the economics of derivatives, income on collateral and your broker’s charges do not all appear in the same place. Adding every number you find can be just as misleading as reading only the headline fee.
Sources checked October 24, 2026. This article concerns US-listed ProShares UltraPro QQQ. Disclosed fees, waivers and portfolio exposures can change.
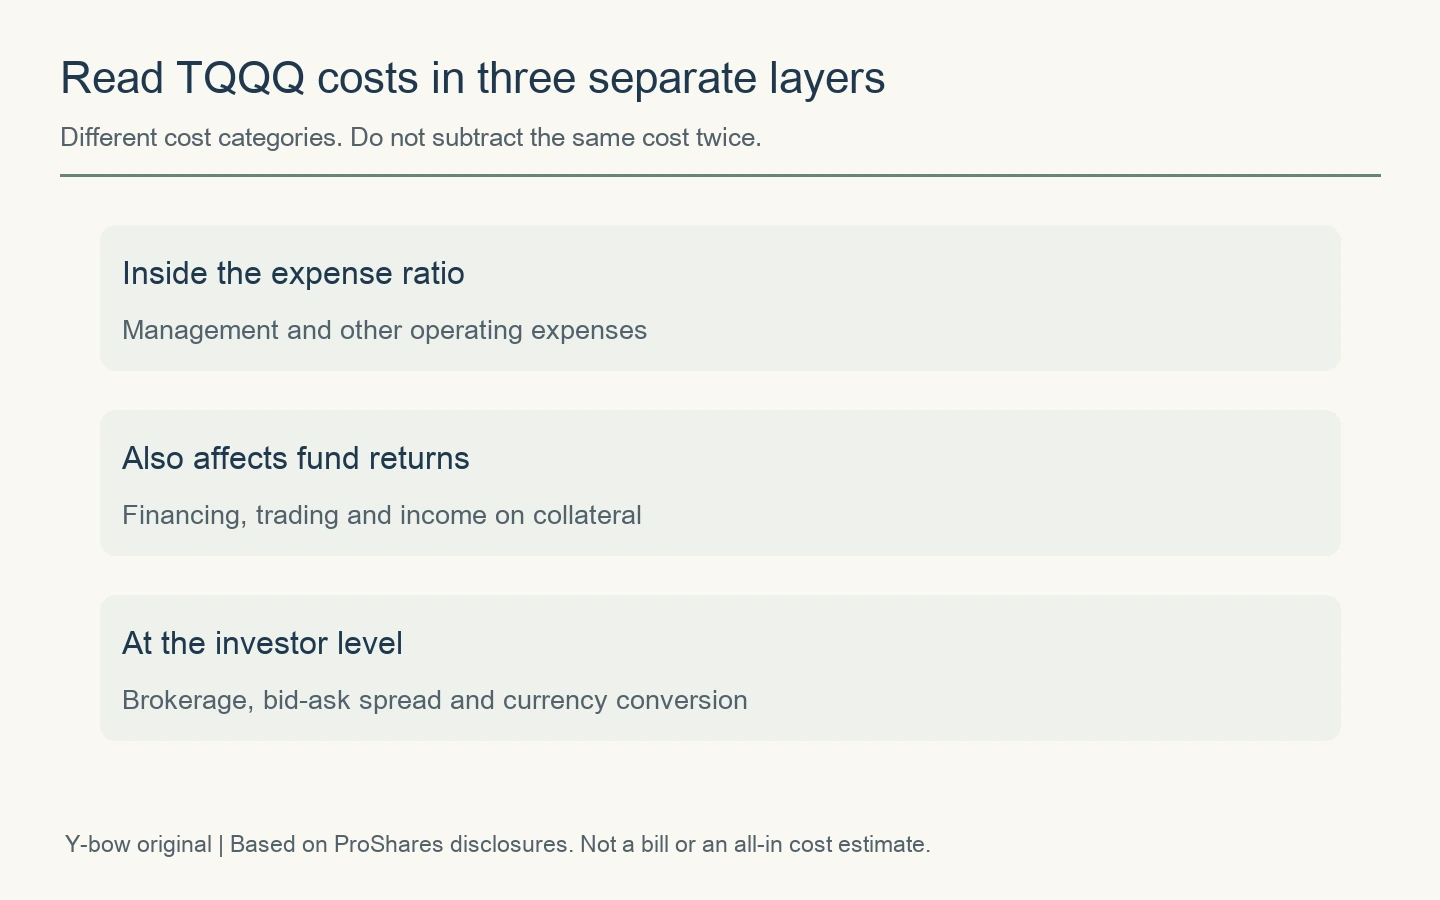
What TQQQ’s expense ratio includes—and leaves outside the table
The September 28, 2026 summary prospectus shows annual operating expenses of 0.94% before waivers and reimbursements and 0.78% afterward. These are two versions of a fee measure, not two separate charges to add together.
The same document explains that transaction and financing costs associated with securities and derivatives are outside the fee table and its expense example. The net expense ratio is therefore not an all-in measure of the economic drag on an investor. That does not make every item outside it an improper or secret charge.
Does 0.78% mean $78 on $10,000?
At an unchanged $10,000 balance for a full year, multiplying by 0.0078 gives $78. That is a simple way to understand the scale of a rate, not a calculation of your actual bill. Assets fluctuate, expenses accrue over time and fund-level costs affect NAV.
The prospectus describes contractual waivers through September 30, 2027. Do not assume today’s net rate remains unchanged forever. Equally, do not subtract the gross rate and then subtract the net rate again. A precise-looking spreadsheet can still contain a basic double count.
How TQQQ creates leveraged exposure with swaps and futures
TQQQ is not simply your brokerage account borrowing exactly twice your initial cash. It combines financial instruments to pursue its daily objective. Contract notional, market value and cash allocated are different measures.
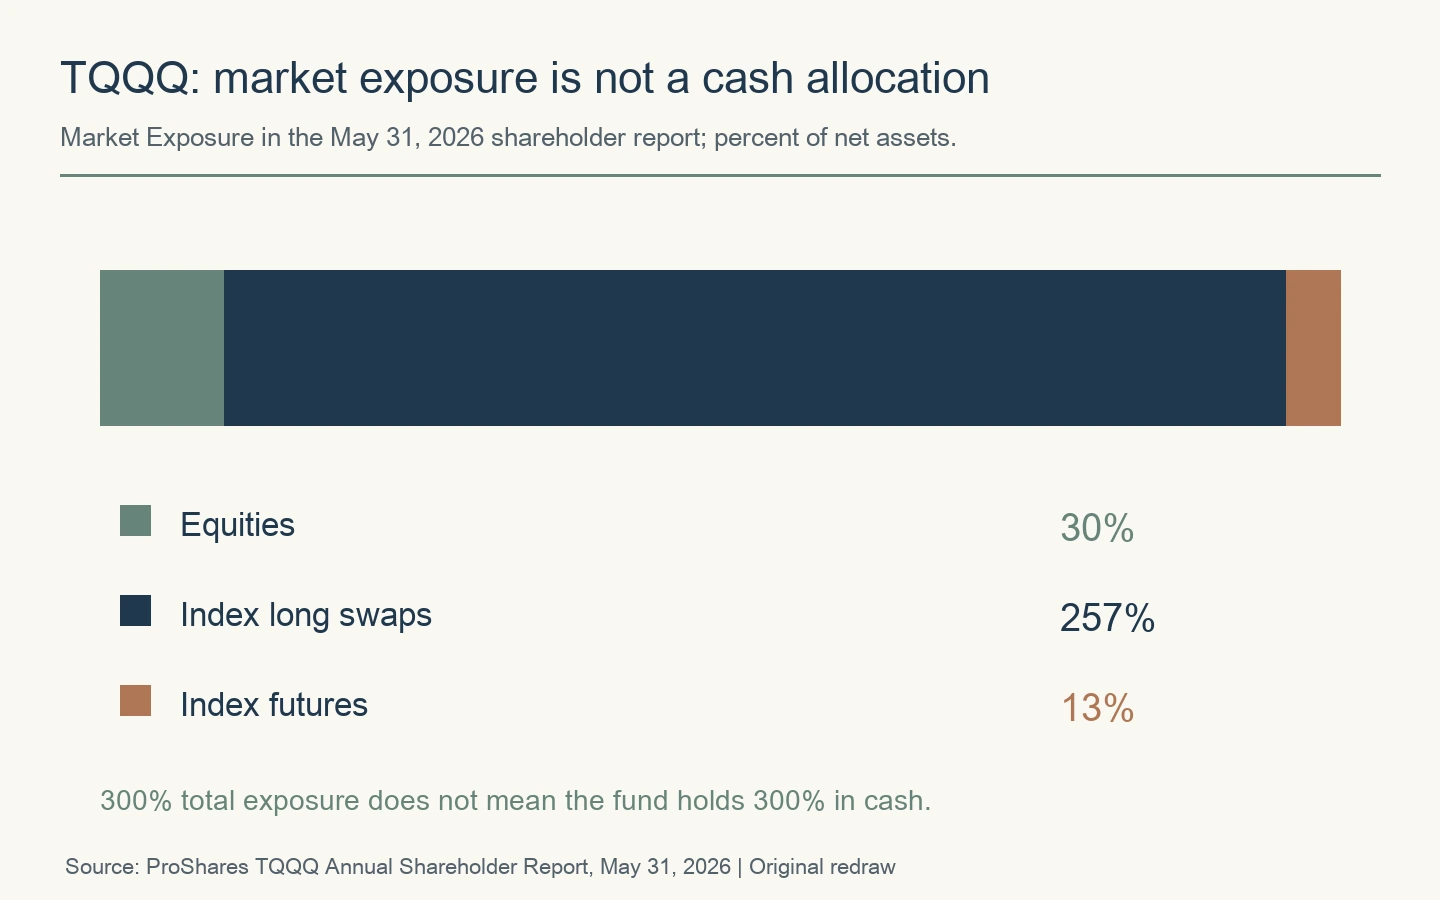
The May 31, 2026 annual shareholder report lists market exposure of 30% in equity securities, 257% in Nasdaq-100 long swaps and 13% in index futures, totaling 300% of net assets. Those are dated exposures, not a statement that the fund holds three times its assets in cash or that the mix remains unchanged.
Swap notional is not the same as a cash loan
A swap exchanges returns under agreed terms. Its notional is the amount used to calculate those returns; it is not necessarily cash borrowed and transferred to the fund. Financing terms, spreads, collateral arrangements and income on other assets affect the economics.
That is why multiplying every derivative notional by the policy rate does not establish an exact cost. The opposite shortcut—asserting that the fund always pays the policy rate on exactly twice its NAV—is not a complete description either. You need the actual instruments and terms, including how they are presented in the accounts.
Read holdings with a specific question. Are you looking at dollars of market value, percent of NAV or economic exposure? A large cash or Treasury position can support derivatives without being the equity exposure you intended to measure.
Advertisement
A one-percentage-point rate change: a transparent calculation
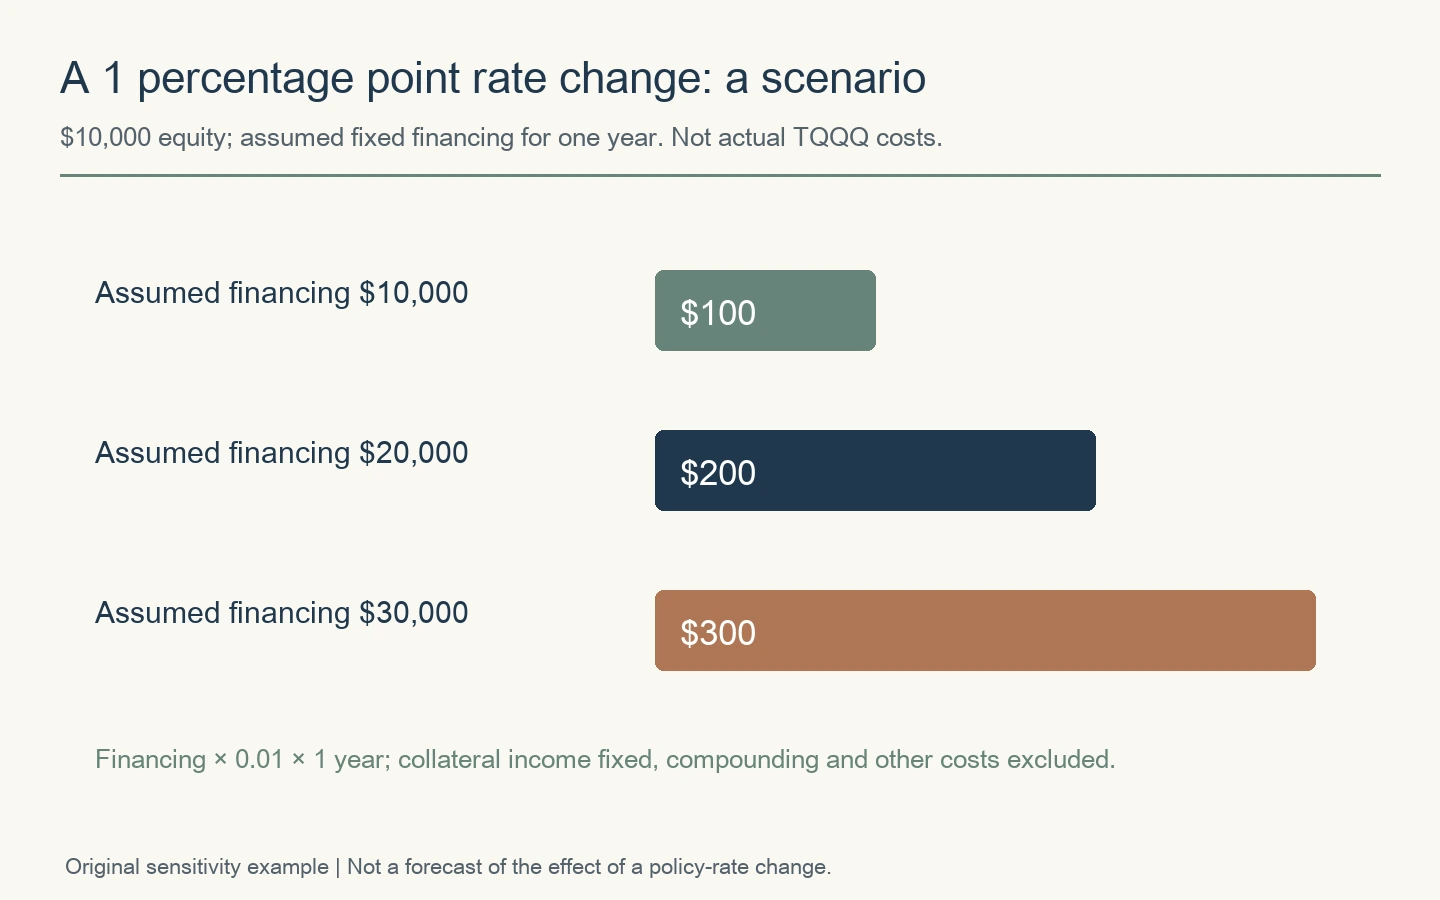
Instead of inventing TQQQ’s exact future financing bill, hold a few variables fixed. Assume $10,000 of investor equity and $20,000 of financing for a full year. Suppose the financing rate alone rises from 4% to 5%.
$20,000 × 0.01 × 1 year = $200.
The change is one percentage point. This is a hypothetical sensitivity calculation, not TQQQ’s actual annual cost.
The income side can change too
Now make one additional assumption: income on $10,000 of collateral also rises by one percentage point. That adds $100 of income. With everything else unchanged, the $200 financing-cost increase is partly offset, leaving a $100 net increase.
This second scenario is not a claim that TQQQ holds precisely that collateral, or that both rates always move together. It shows why a financing discussion needs an income side as well as an expense side. Contract resets, reference rates and balances matter.
A policy-rate cut therefore does not produce a guaranteed improvement of a fixed size. The relevant rates may reset differently, while equity prices, volatility and collateral yields change as well. A cheaper source of leverage can coexist with a worse investment outcome.
Which fund document answers which cost question?
| Document | Useful for | Does not establish by itself |
|---|---|---|
| Summary prospectus | Expense rates, waiver terms, daily objective, exclusions | All future financing costs |
| Shareholder report | Reporting-period results, expense information, dated exposures | An unchanged future portfolio or return |
| Holdings and contract notes | Instruments, notional and disclosed terms at a date | Missing contract details or future balances |
| Broker fee schedule | Your commissions, conversion and account terms | The fund’s entire internal cost structure |
Start with the fee table, then inspect how exposure is obtained, then read the relevant reporting period. A reported expense amount in dollars need not equal the starting investment times a simple annual percentage: the asset balance and reporting calculation matter. A mismatch alone is not proof of an extra hidden charge.
Also distinguish an investor’s costs from the fund’s. A commission-free trade still crosses a bid-ask spread. Currency conversion can matter if your spending currency is not the dollar. A broker’s low commission does not eliminate the fund’s operating or financing costs.
Why the gap from “three times the index” is not all fees
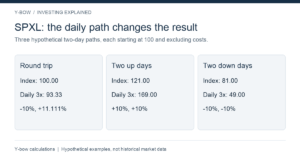
Consider an imaginary index that rises 10% on day one and falls 10% on day two. Starting at 100, it finishes at 99: a cumulative loss of 1%. A perfect daily 3x investment with zero costs goes from 100 to 130 and then to 91, losing 9%.
Multiplying the index’s two-day loss by three gives −3%, which is different from −9%. That six-percentage-point gap exists in this example even with no fees. It comes from daily compounding. Attributing the entire gap to financing would misdiagnose the mechanism.
For an empirical investigation, align dates and distribution treatment, distinguish NAV from market price and build the daily target path. Even then, do not allocate every residual difference to one expense. Valuation, execution, rebalancing and tracking effects can also matter. Our TQQQ daily-leverage guide and index-recovery explanation cover that separate question.
Five cost checks before buying or continuing to hold TQQQ
- Read gross and net expenses and the waiver’s end date.
- Identify exclusions without subtracting the same cost twice.
- Separate derivative notional from cash borrowing.
- Align dates, distributions and NAV versus market prices in return comparisons.
- Include your broker’s costs and consider how losses affect money you need for other purposes.
The important result is not a single impressive “true fee” number. It is knowing which charges are disclosed, which economics require assumptions, and which return differences are not fees at all. That makes both a bullish rate-cut story and a frightening hidden-cost claim easier to examine.
Sources, calculations and updates
Primary references are the September 28, 2026 summary prospectus, May 31, 2026 shareholder report, issuer product page and geared-fund FAQ. All three diagrams are original. Scenario arithmetic holds the stated balances fixed; the two-day example excludes costs and taxes. These are explanations, not forecasts or personalized recommendations.
Check new prospectuses and waiver changes before relying on a quoted rate. We keep the document date beside a figure so readers can distinguish a durable method from a time-specific observation.




Comments