

You want some gold because an equity-only portfolio feels uncomfortable. Then a list of tickers appears: GLD, IAU, GLDM and perhaps IAUM. If they all hold gold, should you simply select the lowest annual fee? And does a lower share price mean you are buying the metal more cheaply?
This comparison concerns US-listed physically backed gold products, not mining equities, futures-based products or leveraged funds. Official disclosures were checked on October 31, 2026. Our numerical examples explain costs and currency mechanics; they are not gold-price forecasts or product recommendations.
What GLD, IAU, GLDM and IAUM represent
These products seek gold-bullion exposure after expenses. That is different from owning mining businesses whose profits depend on operating costs as well as gold prices. The familiar “gold ETF” label also does not make every legal or regulatory feature identical to a conventional stock ETF. iShares explicitly notes that IAU and IAUM are not investment companies registered under the Investment Company Act of 1940.
← Swipe to view the full table →
| Product | Annual disclosed charge | Official provider |
|---|---|---|
| GLD | 0.40% | State Street |
| IAU | 0.25% | iShares |
| GLDM | 0.10% | State Street |
| IAUM | 0.09% | iShares |
Sources: GLD, IAU, GLDM and IAUM. The legal fee labels follow each disclosure. These annual charges are not an all-in estimate of brokerage, spread or currency costs.
Original cost scenarios: one, five and ten years
Assume a $10,000 investment, a flat gold price, and entry and exit costs of 0.05% each for every product. Deduct the stated annual charge once a year in a simplified model. Real trusts accrue expenses daily, so this is not an accounting replica, a tracking-error estimate or an after-tax return.
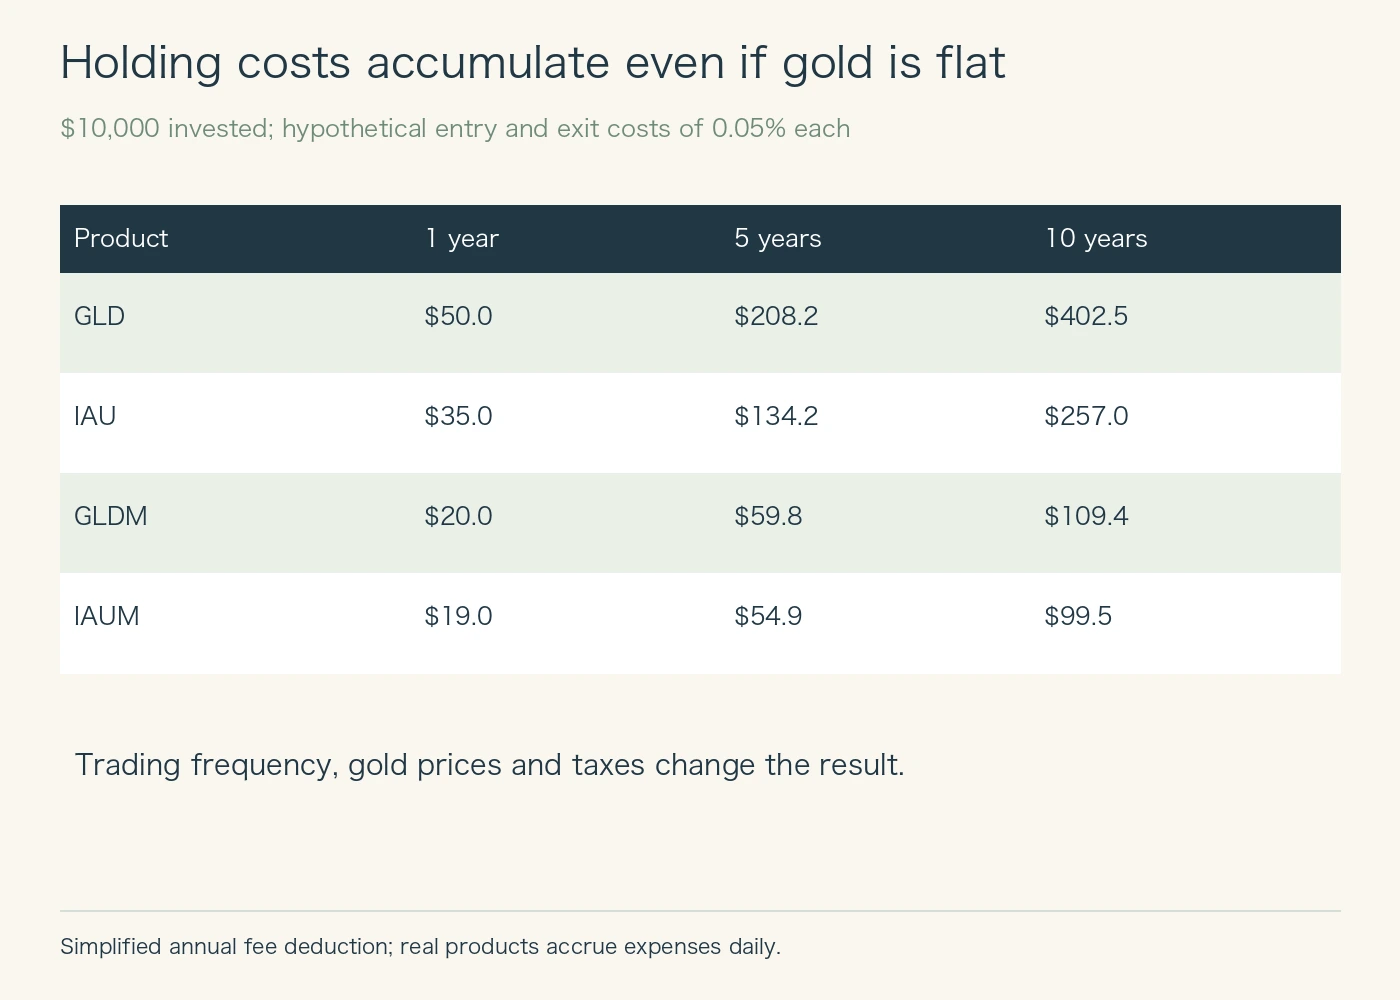
After ten years, the modeled reduction from $10,000 is about $402.5 for GLD, $257.0 for IAU, $109.4 for GLDM and $99.5 for IAUM. The modeled GLDM–IAUM difference is roughly $9.9. A one-basis-point fee gap is real, but its dollar size here should be compared with execution differences, not read in isolation.
Terminal proceeds equal 10,000 × (1 − entry cost) × (1 − annual charge)^years × (1 − exit cost). Rising or falling gold changes dollar outcomes; repeated trading adds new transaction costs. Historical published NAV returns normally already reflect ongoing expenses, so subtracting the annual charge again from those returns can double-count it.
Advertisement
When spreads and holding periods outweigh a fee difference
A bid–ask spread separates the price at which you can sell from the price at which you can buy. Keep a consistent reference, such as the midpoint, when estimating entry and exit costs. Do not subtract the full quoted spread twice at entry and twice again at exit, then label the inflated total a real trading cost.
Suppose one product saves 0.01 percentage points annually but costs an additional 0.10 percentage points over the round trip. A simple fee-only approximation needs about ten years to offset that initial disadvantage. Those are hypothetical inputs, not current quotes for any named trust. They show why an investor should bring actual order size, available prices and expected holding period to the comparison.
A published 30-day median spread describes earlier observations, not a guaranteed future fill. Order size, session and stressed markets matter. Large assets and high trading volume can be useful information, but they do not certify your next execution. A long-term saver and a frequent trader can therefore reach different conclusions without disagreeing about the annual fee.
Why a lower share price does not mean cheaper gold
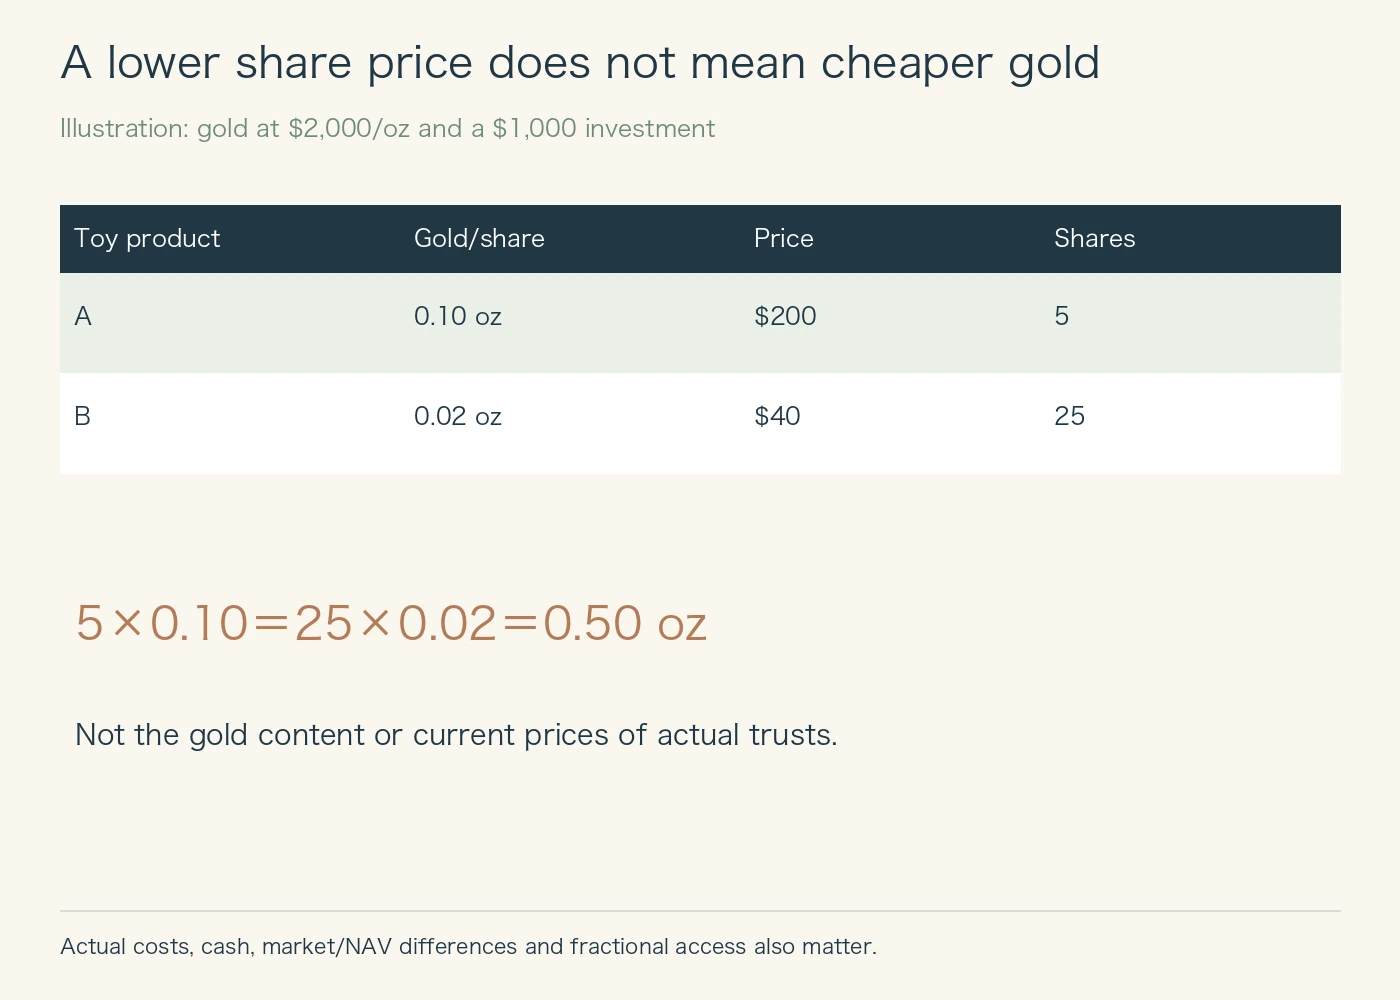
Imagine product A represents 0.10 ounce per share and trades at $200, while B represents 0.02 ounce and trades at $40. At a hypothetical $2,000-per-ounce gold price, $1,000 buys five A shares or twenty-five B shares. Both represent half an ounce. The lower ticket size can help whole-share purchasing, but it does not establish cheaper exposure per ounce.
A trust may sell gold to meet expenses, reducing the gold represented by each share over time. Do not use an old ounces-per-share figure as a permanent conversion factor. Read current gold holdings, shares outstanding, cash and liabilities. Also distinguish authorized-participant creation/redemption from a small investor’s ability to demand physical bars; ordinary share ownership does not imply unrestricted retail physical redemption.
Gold-price returns and home-currency returns are different
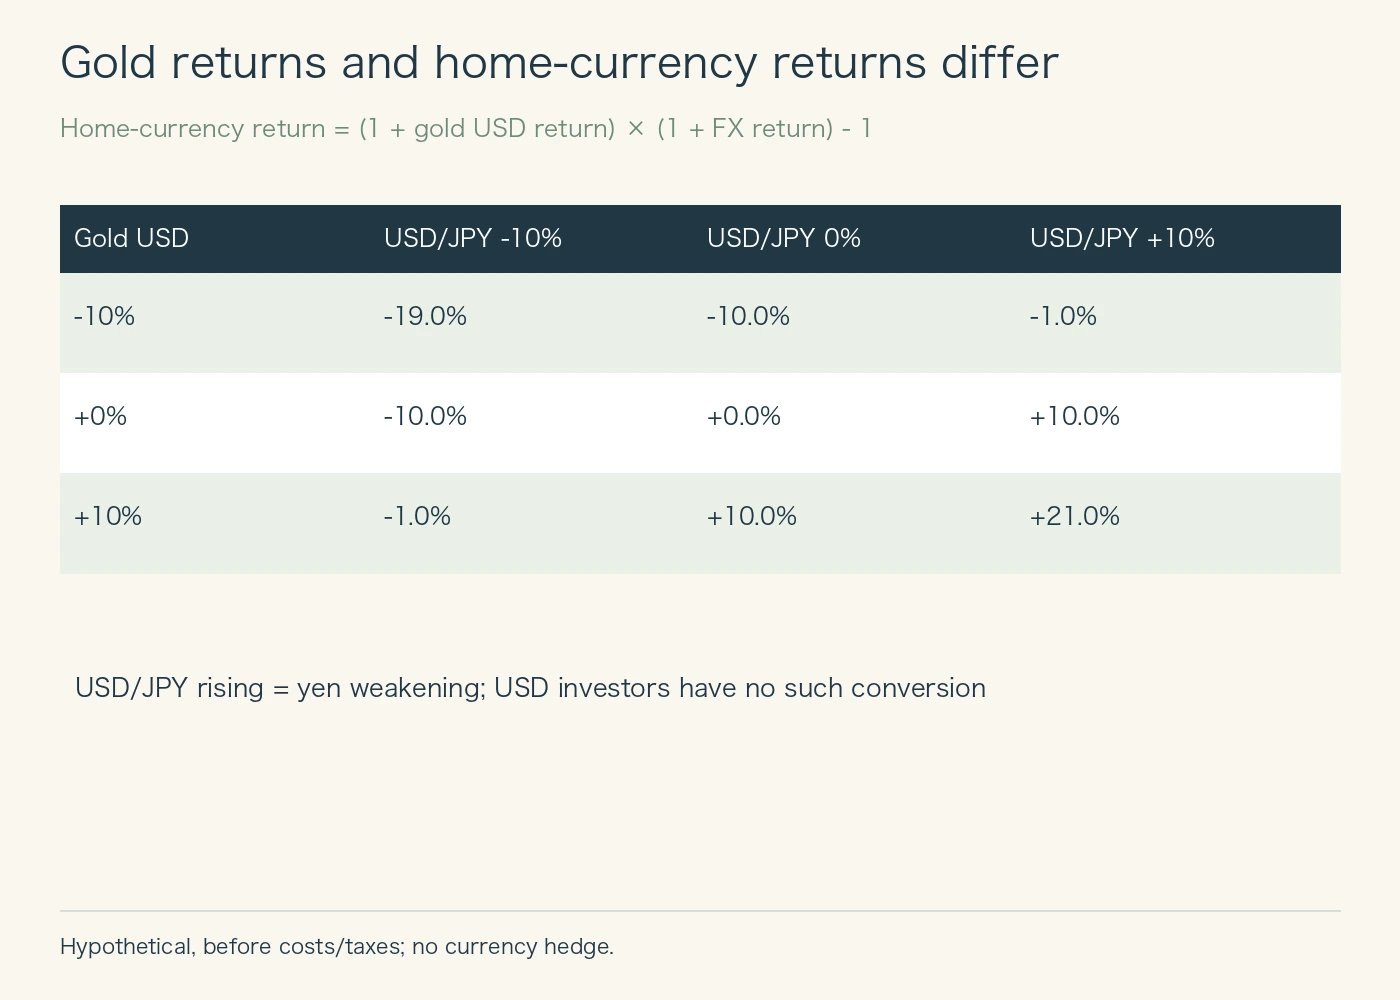
For an unhedged yen-based investor, a 10% increase in gold’s dollar price combined with a 10% fall in USD/JPY produces 1.10 × 0.90 − 1 = −1% in yen before costs. If gold is flat and USD/JPY rises 10%, the yen return is 10% before costs. These are currency identities, not forecasts of gold or the dollar.
A US investor spending dollars does not add this yen conversion. Other investors should use their own spending currency and check hedging. A locally quoted product is not automatically currency-hedged, and domestic wrappers can have different expenses and tax treatment from US-listed trusts. Compare legal products rather than assuming a translated ticker list gives everyone the same result.
Related book (affiliate advertisement)
Background reading on diversification, trading costs and investment discipline. It is not presented as endorsing the specific orders or products discussed here.
A Random Walk Down Wall Street (English paperback)
View this edition on Amazon Japan
Check the linked page for price and availability. As an Amazon Associate, Y-bow earns from qualifying purchases.
Advertisement
A checklist beyond the lowest annual charge
← Swipe to view the full table →
| Question | What to verify |
|---|---|
| Structure and custody | Trust structure, custodians, inspection and reporting |
| Ongoing costs | Latest disclosure and effects on assets per share |
| Execution | Actual quotes, size, commissions, conversion and fractional access |
| Tax and account | Residence, account type, sale and trust-level transactions |
| Portfolio role | A complement or replacement, and the loss you can accept |
US tax descriptions should not be exported unchanged to Japanese residents or other jurisdictions. Taxable and retirement accounts can differ as well. This article does not rank the products after tax for a particular investor. Gold does not generate business earnings or interest in the same way as stocks or bonds, and it is not guaranteed to rise whenever equities fall.
Related guides, sources and update policy
For operating-company exposure, see our gold-bullion versus mining-fund guide. For execution mechanics, see ETF orders and spreads. The present article evaluates new exposure; it does not recommend selling an appreciated holding purely to chase a lower annual charge.
The four official product pages above link to prospectuses and supporting reports. See also IAUM’s 2025 Form 10-K for the sale of gold to cover expenses and its effect on gold represented by each share. We date expense observations, avoid fixed-spread winner rankings and will revisit material changes in costs, structure and relevant tax references. The header is AI-generated conceptual artwork; the three figures are original calculations and diagrams.





Comments