
A chart comparing different investment start dates can be persuasive. It can also compare unequal amounts of time or money without making the difference obvious. Before asking which starting year won, check what the experiment actually measured.
This matters especially for regular contributions and leveraged products. A favorable endpoint can conceal both the path experienced by the investor and assumptions that cannot be reproduced.
Define the same period in months, not just year labels
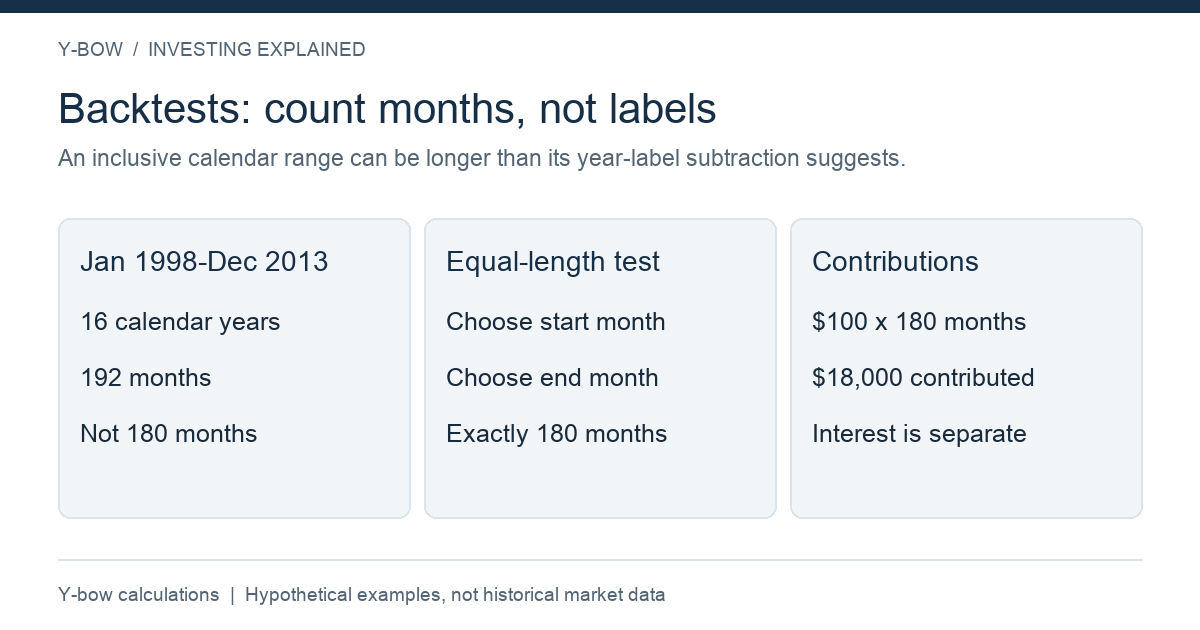
January 1998 through December 2013 includes 192 months, or 16 years. Calling that a 15-year period would misstate the test. A genuine 180-month comparison needs explicit first and final contribution dates.
The Japanese source article previously used year-based labels without establishing identical 180-month windows. Its old table also mixed contributed principal with a cash balance that included interest. Those unverified results are not reproduced here as evidence.
| Item to specify | Why it changes the result |
|---|---|
| First and final valuation dates | Determines the investment horizon |
| Contribution date within each month | Changes the purchase price and time invested |
| Amount and timing of contributions | Separates invested money from investment performance |
| Dividends, fees and taxes | Determines the return actually retained |
| Currency and product identity | Prevents comparing different exposures as if identical |
Use a small example you can reproduce
Imagine contributing $100 at the beginning of each of four months. Purchase prices are 10, 8, 12 and 10. You buy 10, 12.5, 8.333 and 10 units, or about 40.833 units in total. At a final price of 10, the ending balance is about $408.33 against $400 contributed. This excludes costs, dividends and taxes.
Now reverse the middle prices to 12 and 8. With the same four beginning-of-month purchases and endpoint, the ending units remain the same. But that does not establish that order never matters: withdrawals, different contribution amounts, costs or a different endpoint can change the comparison.
A lump-sum investment of $400 at the initial price of 10 ends at $400 in this invented path. On a steadily rising path, investing available cash earlier can produce a different result. One example is not a general victory for either method.
Existing cash and future salary are different decisions
If you already have an investable lump sum, gradually deploying it leaves some money out of the market for a time. That can reduce immediate exposure to a fall, while also creating an opportunity cost when markets rise.
If the money arrives as monthly salary, you cannot invest all future salaries on day one. A fair comparison needs to respect when each dollar actually becomes available. FINRA's discussion of dollar-cost averaging distinguishes these situations.
Do not treat a substitute product as live history
A fund with a long history may be used as a proxy for a newer fund, but differences in fees, leverage, hedging, trading and taxes must be disclosed. UOPIX, a U.S. mutual fund, is not the same product as the U.S.-listed QLD ETF or a Japanese leveraged Nasdaq mutual fund.
For daily leveraged strategies, reconstructing returns from a benchmark is a theoretical calculation unless actual product data are used. Financing costs, tracking differences and fund changes can matter. Our daily leverage guide explains why a long-period multiple is insufficient.
Use start-date tests to explore vulnerability
Rather than selecting only favorable years, examine rolling periods with the same length. Record the worst drawdown, money contributed, ending balance and whether spending needs could have forced a sale. A modest endpoint gain after a severe interim loss can be difficult to live through.
Read the backtesting checklist alongside the Japanese start-date article. A reproducible comparison is useful because you can challenge its assumptions, not because it removes uncertainty about your own future starting date.
Sources and review date
Reviewed October 14, 2026. Sources: FINRA's linked 2026 explanation and the SEC's leveraged ETF bulletin. All four-month numbers are original hypothetical calculations. No historical fund-performance series is asserted in this article.






Comments