
An ETF can trail its index by a small amount and still be very consistent. Another can end the year with a similar shortfall but swing around its benchmark from day to day. Tracking difference describes a performance gap over a period. Tracking error describes the variability of the periodic gaps.
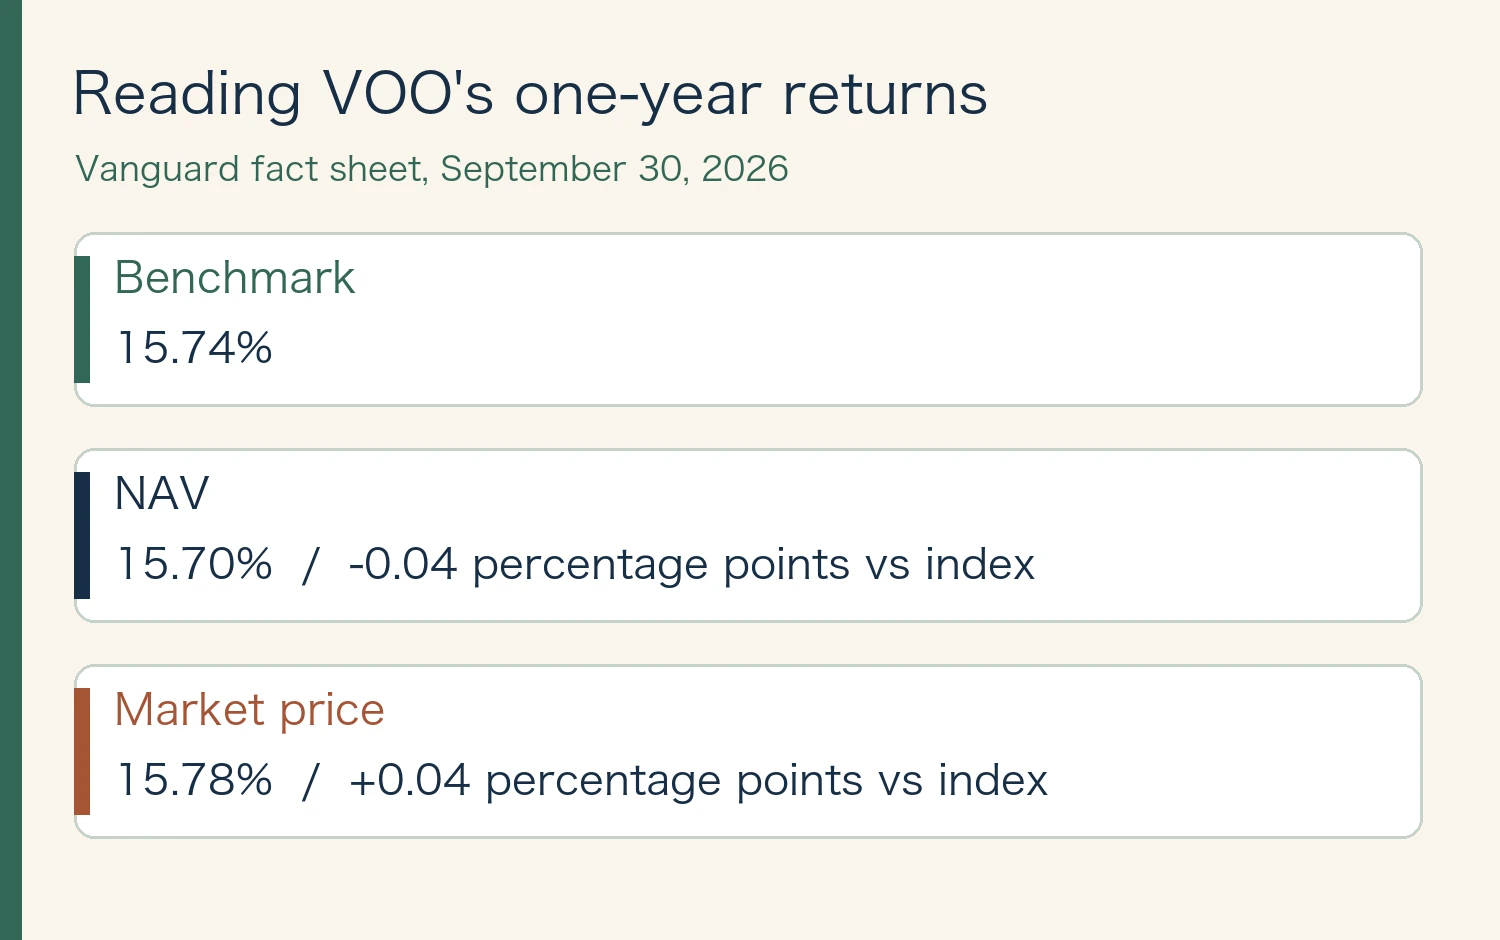
Vanguard’s September 30, 2026 VOO fact sheet provides a concrete example. For the same year, it reports a 15.70% NAV return, a 15.78% market-price return and a 15.74% index return. At the published precision, NAV trails by 0.04 percentage points while market price leads by 0.04 points. The period and fund did not change. The return series did.
Choose NAV, market price or the index deliberately
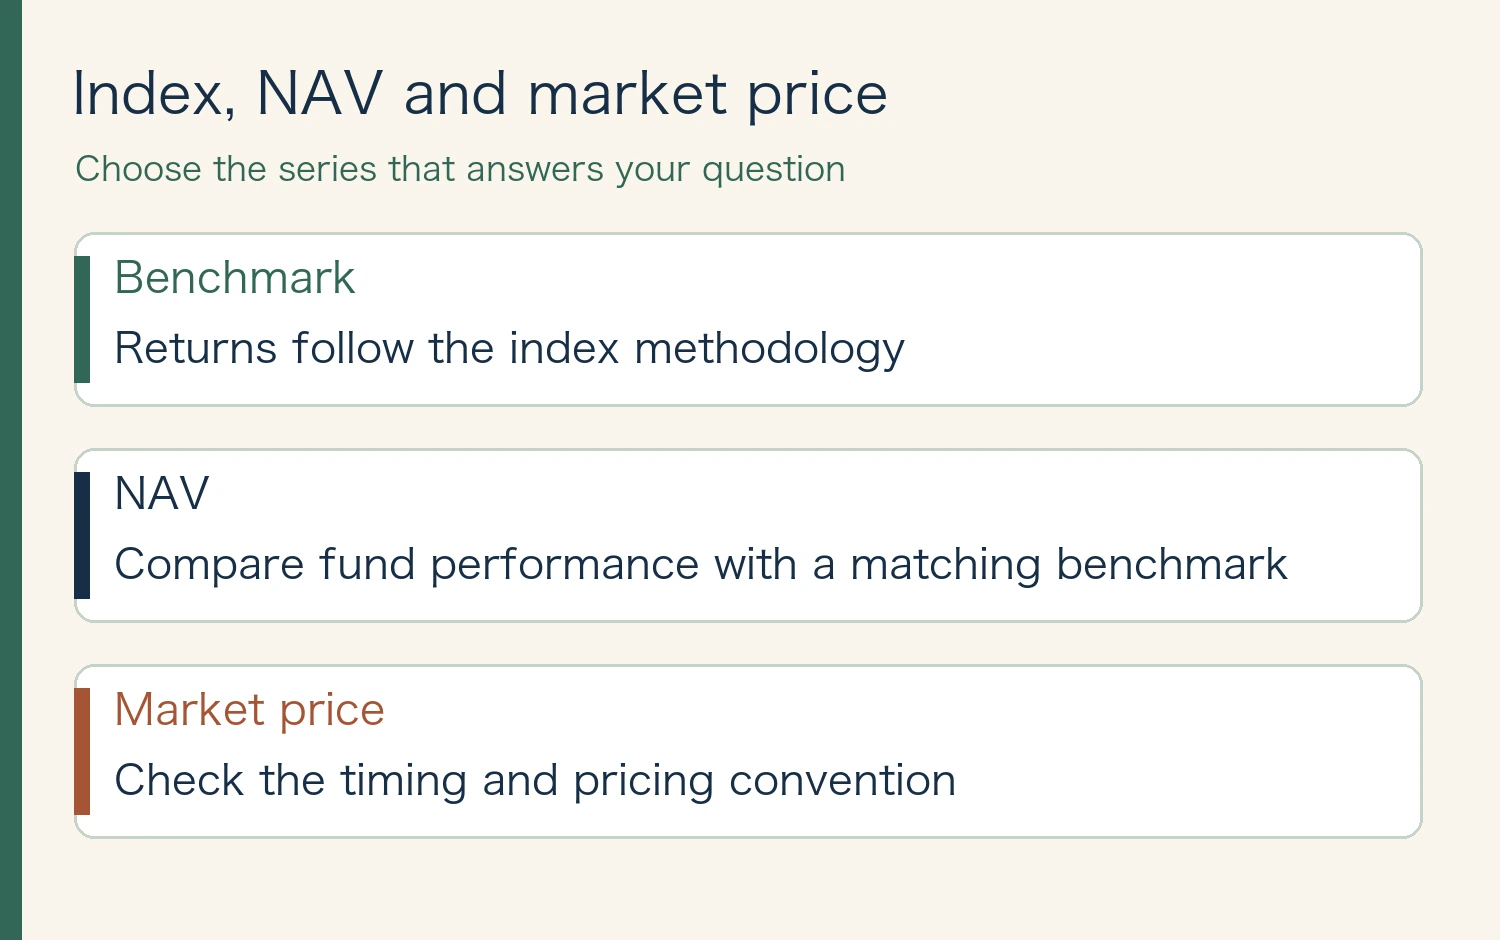
An index is a calculated benchmark. Its methodology specifies how to treat constituents, dividends and other events. A fund’s NAV is the net value of its assets per share. Its market-price return follows a trading-price convention that may use a different observation point from NAV. To assess portfolio tracking, start with NAV total return and the comparable index series.
To assess your own result, start with execution prices, distributions and your costs. A premium or discount to NAV at a single time describes a price gap, while tracking difference compares returns across a period. The distinction matters if you are trying to explain why your account and a fact sheet report different numbers.
Advertisement
Calculate tracking difference over a matched period
Use fund total return minus benchmark total return. Write down the sign convention because some sources reverse it. Match the dates, currencies, dividend treatment and whether the returns are cumulative or annualized. If a document compares an ETF with a price-only index, a dividend-driven gap can appear even if the fund tracks its intended total-return benchmark closely.
The VOO example shows a one-year difference calculated from rounded figures. It does not isolate the expense ratio. Fees, trading, taxes, index implementation, portfolio sampling and securities lending can all affect the gap. Their importance can vary across funds and periods.
Measure tracking error from a series of active returns
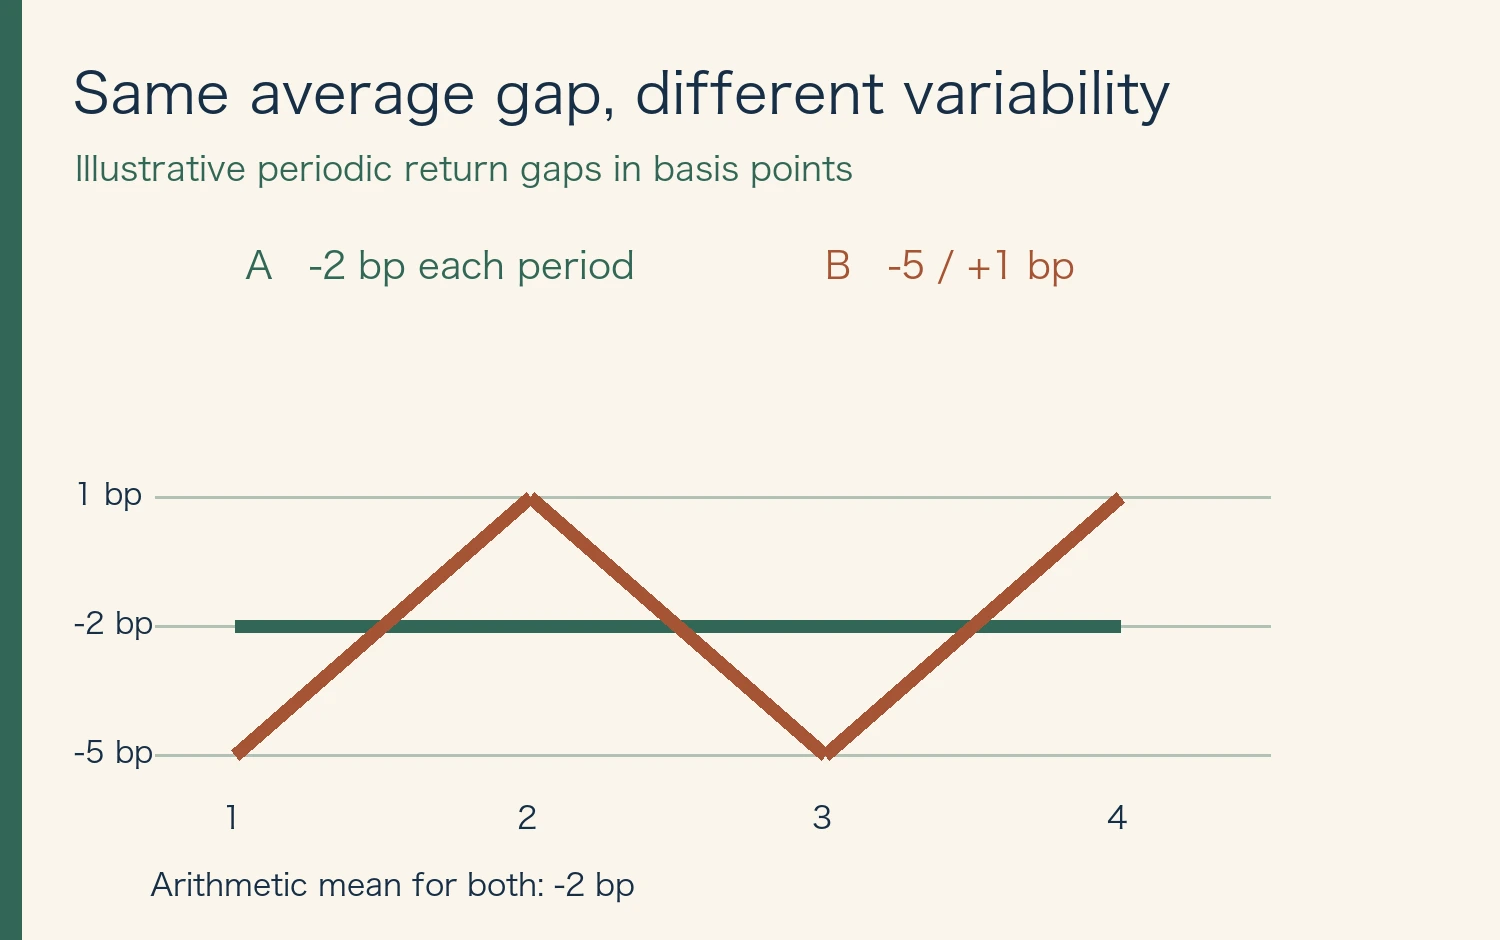
A common calculation uses the standard deviation of periodic fund-minus-benchmark returns. Imagine four periods. Fund A has gaps of −2, −2, −2 and −2 basis points. Fund B has −5, +1, −5 and +1. Both average −2 basis points, but B has more variability. That arithmetic mean illustrates the difference between bias and variability. It is not the compounded tracking difference for the full period.
If tracking error is annualized, note the observation frequency and the convention used to scale the result. A single fund-versus-index annual return pair cannot tell you how widely the periodic differences fluctuated.
← Swipe to view the full table →
| Item | What to verify |
|---|---|
| Benchmark | 15.74% |
| NAV | 15.70% / −0.04 percentage points vs index |
| Market price | 15.78% / +0.04 percentage points vs index |
Advertisement
Read a fact sheet in this order
Identify the exact benchmark first. Align the periods, currency, tax and dividend treatment and valuation time. Put the period gap and the variability measure in separate columns. Investigate the periods where something changes, such as an index rebalance. Leave an explicit note when the underlying series are unavailable or incompatible.
Does a lower fee guarantee closer tracking?
Fees are one component. Compare NAV returns against the same benchmark over the same dates, then look for a separately reported measure of variability. Do not infer either number from the expense ratio alone.
Related reading: ETF orders and execution costs
Sources and review date
Sources reviewed November 12, 2026. Figures and the cover were created for this article. Dated disclosures and illustrative examples are labeled in the figures.
This article is for general education and does not recommend buying or selling a particular product.








Comments