
A TIPS ETF can fall while consumer prices are rising. Inflation changes the cash flows of the securities it holds, but market prices also respond to the real yields investors require. Those effects can pull in opposite directions. The size of each depends on the period and the duration of the portfolio.
In October 2026, State Street used the distinction between real yields and inflation compensation to compare TIPS and nominal Treasuries. That makes a useful starting point for interpreting current Treasury data. Keep any dated yield comparison separate from the mechanics that will still apply next year.
How individual TIPS payments adjust
The US Treasury adjusts TIPS principal using a designated consumer price index. A fixed coupon rate is applied to the adjusted principal, so the cash interest changes. At maturity Treasury pays the higher of the original face value and inflation-adjusted principal. That floor is on the face value, which can differ from the amount you paid in the secondary market.
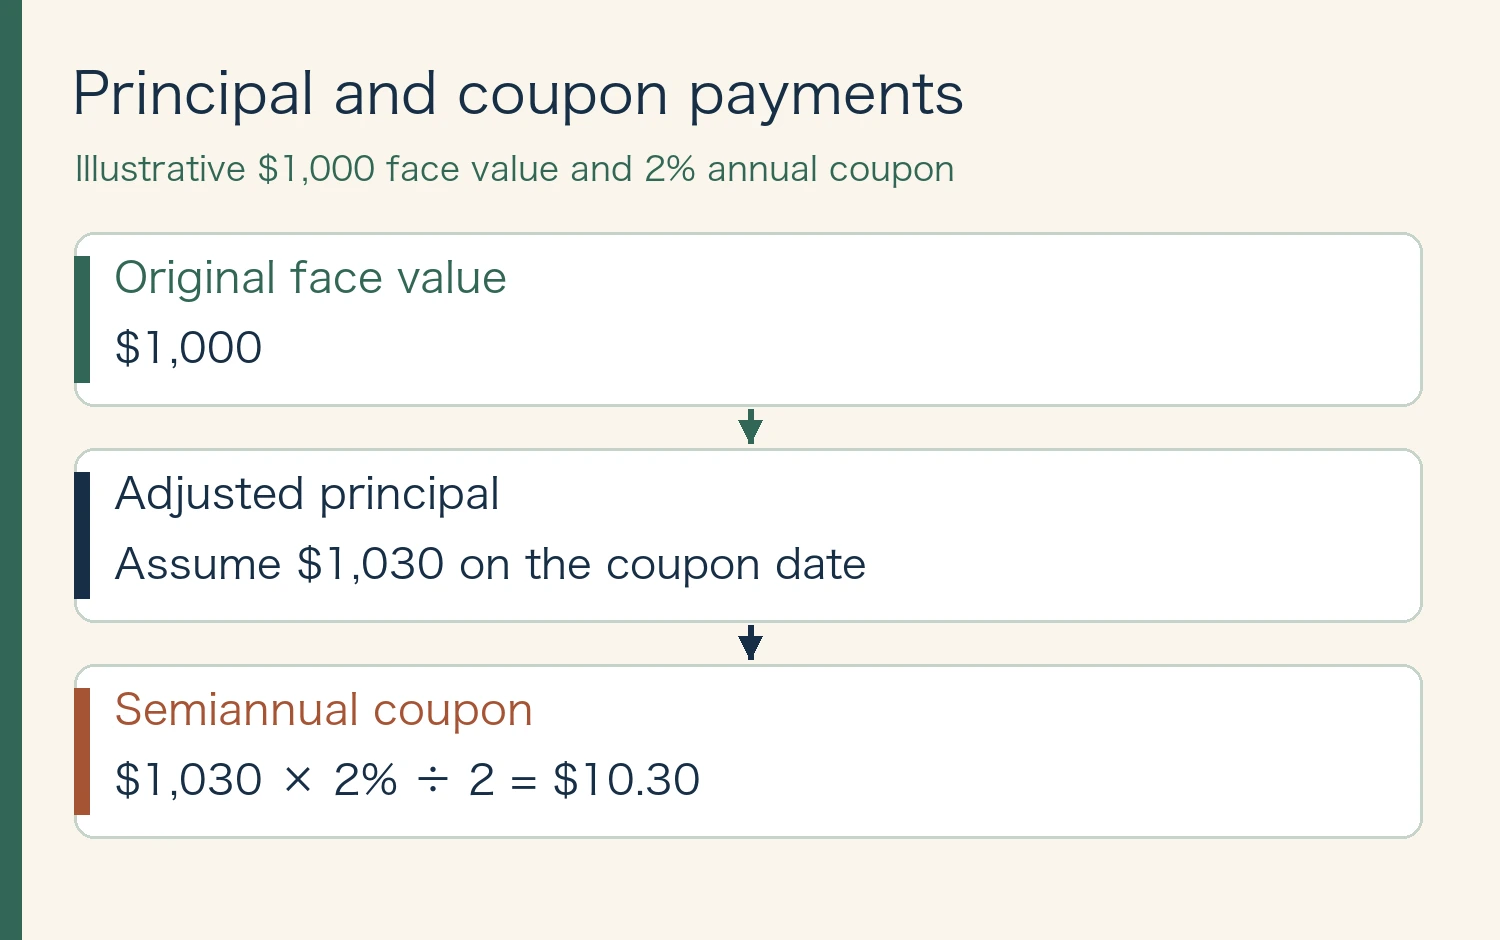
Suppose a bond has a face value of $1,000 and an annual coupon rate of 2%. If inflation-adjusted principal on a coupon date is $1,030, the semiannual coupon is $1,030 × 2% ÷ 2, or $10.30. This illustrates the coupon calculation. It is not a market quote or a holding-period return.
Advertisement
Why rising real yields can pull prices down
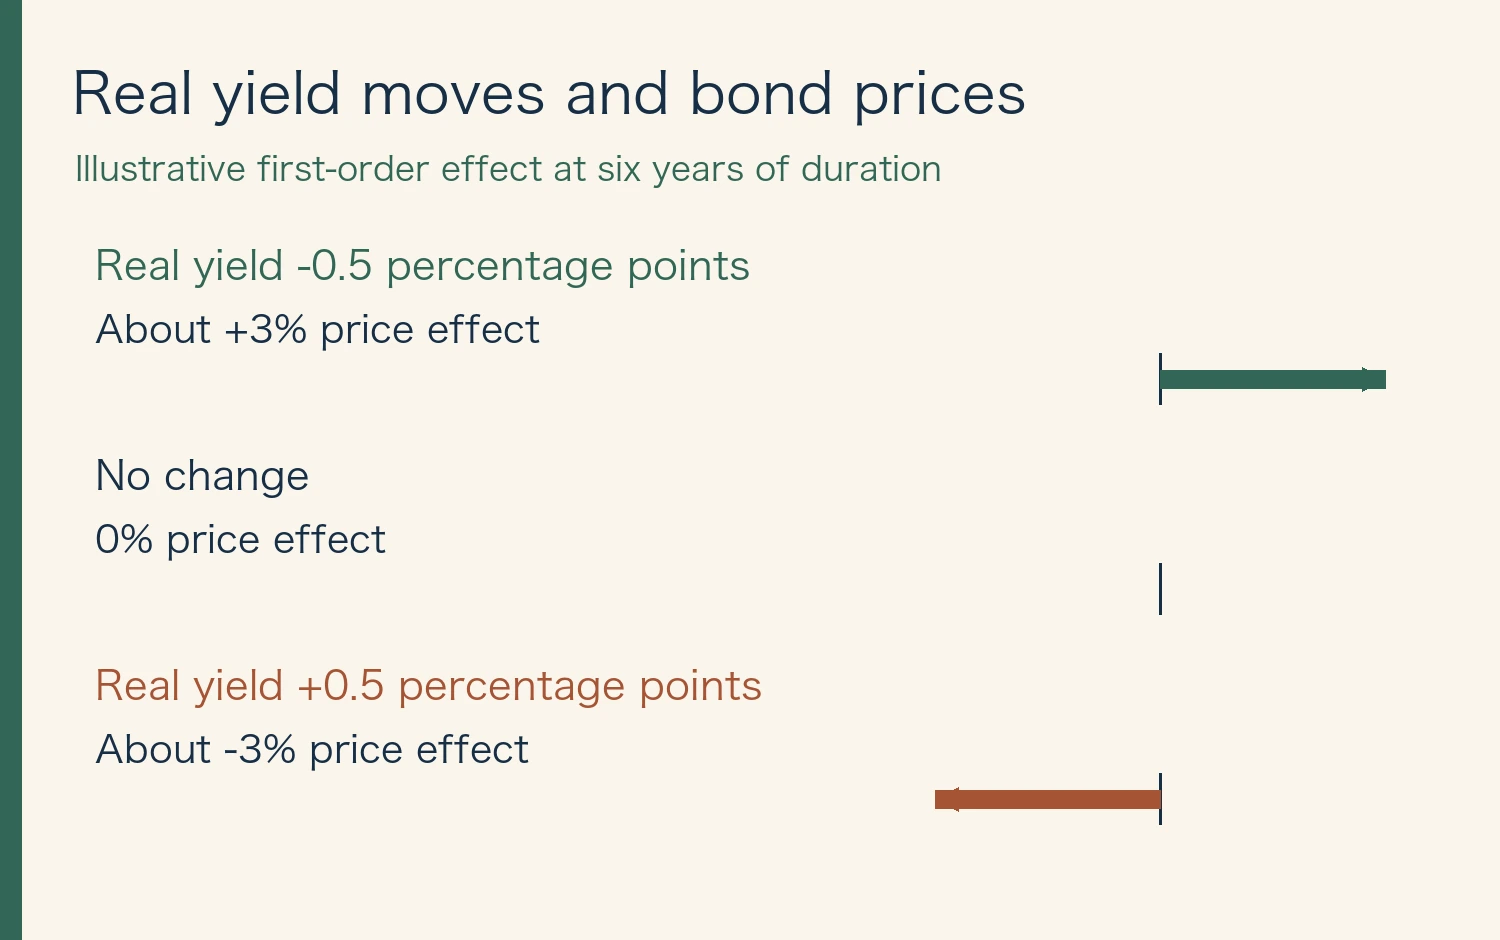
A higher real discount rate generally lowers the price of an existing bond. Consider a portfolio with a hypothetical modified duration of six years. If real yields rise by 0.50 percentage points, the first-order price effect is about −6 × 0.005, or −3%. That approximation excludes inflation adjustment, coupon income, roll-down, convexity and fees.
Duration helps explain why two funds with the same inflation reference can respond differently. It also matters that a conventional TIPS ETF holds a changing portfolio. The maturity protection on individual securities does not create a personal purchase-price floor on a fund share.
What breakeven inflation measures
Subtract the real yield from the nominal yield at the same maturity on the same date. Hypothetical yields of 4.0% nominal and 1.7% real give a spread of 2.3 percentage points. This spread is a measure of market inflation compensation. Inflation risk premiums and differences in liquidity can affect it, so the number is not a standalone CPI forecast.
If you measure results in a currency other than US dollars, exchange rates add a separate effect. Your own cost of living can also move differently from the index Treasury uses. Use the same currency, dates and distribution treatment when comparing fund returns.
← Swipe to view the full table →
| Item | What to verify |
|---|---|
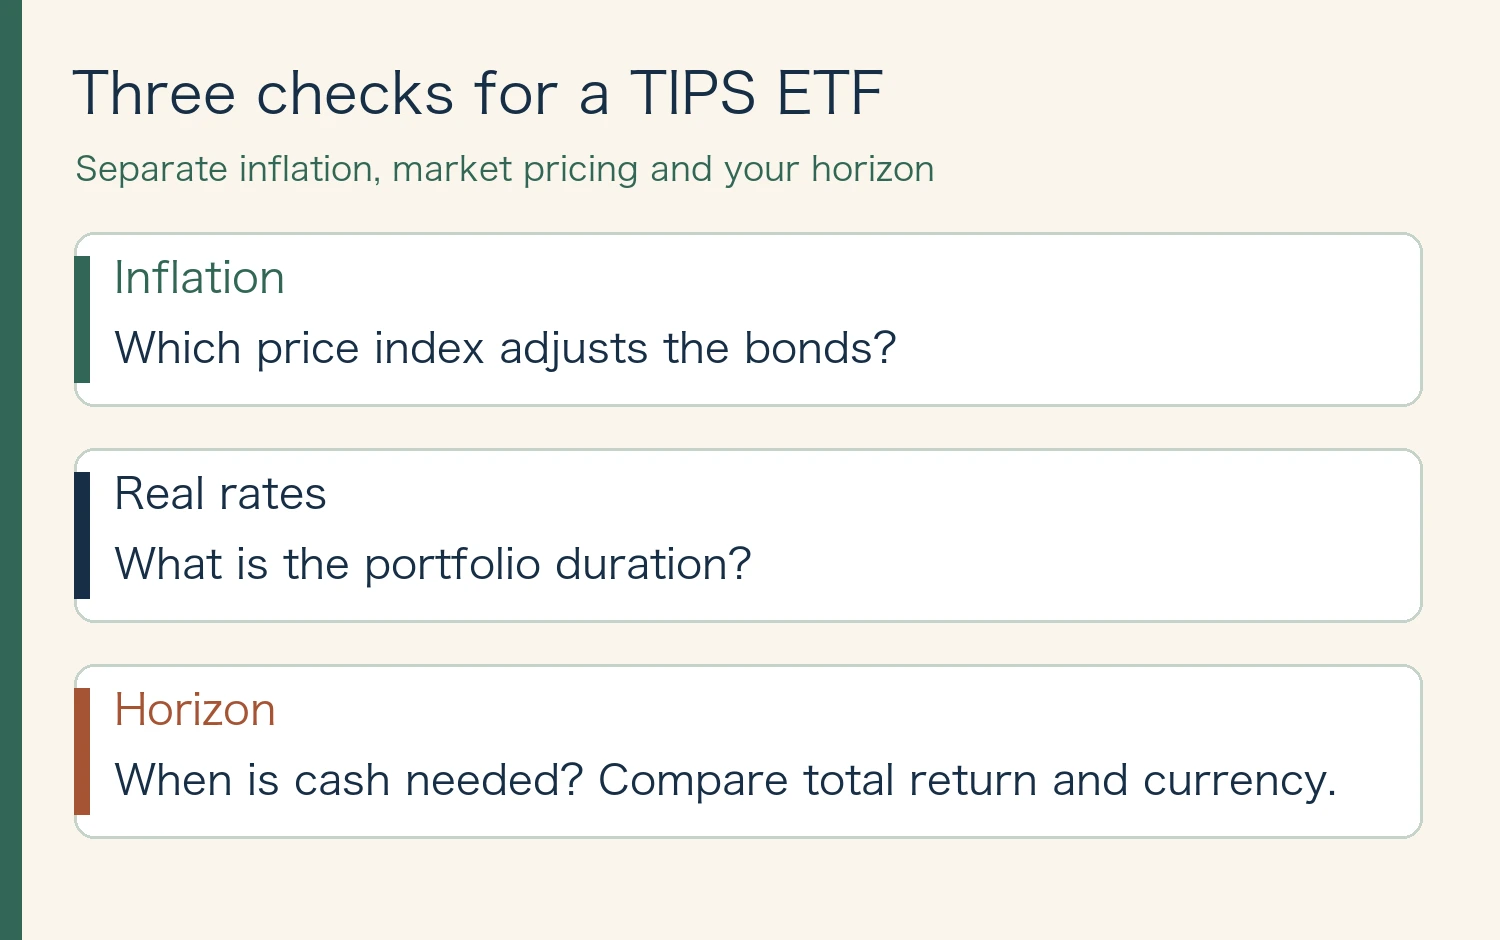
| Inflation | Which price index adjusts the bonds? |
| Real rates | What is the portfolio duration? |
| Horizon | When is cash needed? Compare total return and currency. |
Advertisement
What to check in a fund report
Write down the inflation index behind the holdings, real-rate duration and the date you expect to need the money. Compare total return and NAV separately. A distribution reflects cash paid out, while total return brings distributions and changes in value together. These checks make it easier to recognize real-rate losses even when the bonds’ inflation adjustment is working as intended.
Does a long holding period guarantee recovery of the amount I paid?
The face-value provision belongs to individual TIPS at their maturity. A fund share represents a portfolio whose holdings, value and duration may change. Check the product’s structure and your holding horizon before interpreting that provision.
Related reading: How short-term Treasury ETF distributions work
Sources and review date
Sources reviewed November 12, 2026. Figures and the cover were created for this article. Dated disclosures and illustrative examples are labeled in the figures.
This article is for general education and does not recommend buying or selling a particular product.







Comments