
People need healthcare in good times and bad. It is easy to turn that observation into the much stronger claim that healthcare stocks—or a leveraged healthcare fund—must be safe. That leap is where an investment analysis can go wrong.
CURE combines a healthcare-sector benchmark with daily leverage. The demand for medical care and the risk of owning this particular product are different questions.
What CURE tracks
Direxion states that CURE seeks 300% of the daily performance of the Health Care Select Sector Index before fees and expenses. The fund's objective is daily and is not guaranteed. Direxion: CURE.
The benchmark covers healthcare businesses rather than every company involved in medicine worldwide. The issuer describes industries including pharmaceuticals, equipment, providers, biotechnology and life-sciences tools. Verify current holdings and weights; a broad label does not mean equal exposure to all healthcare activities.
Medical demand is not the same as shareholder return
A business can face strong demand but weak margins if reimbursement does not cover rising costs. A successful product can generate large revenue while patent expiry or competition changes the outlook. A company developing a treatment may have a very different financing profile from a mature provider.
For an investor, these distinctions matter more than a general statement about an aging population. Translate the theme into company-level questions: who pays, who sets prices, what spending is required, and what expectations are already embedded in the stock price?
| Business exposure | Questions worth checking |
|---|---|
| Medicines | Product concentration, patents, pricing and competition |
| Equipment | Replacement cycles, customer budgets and service revenue |
| Providers and services | Reimbursement, labor costs and utilization |
| Life-sciences tools | Research budgets, customer mix and recurring demand |
Why a “defensive” label does not neutralize 3× leverage
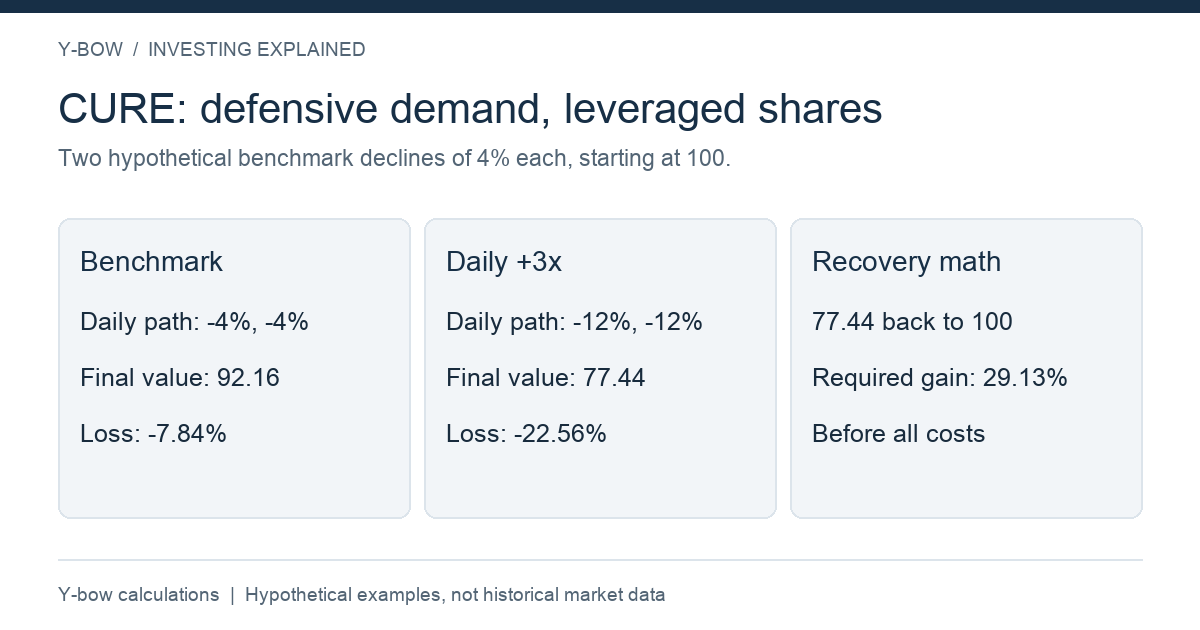
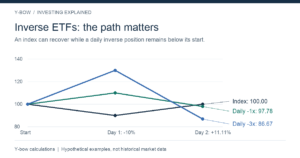
Suppose a hypothetical healthcare benchmark falls 4% on each of two days. It moves from 100 to 96 to 92.16: a 7.84% loss. A theoretical +3× daily position falls 12% each day, ending at 77.44: a 22.56% loss before costs.
Recovering from 77.44 to 100 requires a gain of approximately 29.13%, not 22.56%. The recovery calculation is 100 ÷ 77.44 − 1. This example does not predict a CURE drawdown; it illustrates how a sector decline and daily leverage interact.
Sector diversification can reduce reliance on a single company, but it does not remove a policy shock affecting the whole sector. Daily leverage magnifies that exposure. A smaller percentage decline in the unleveraged benchmark can still create a meaningful household loss when multiplied and compounded.
Do not substitute a healthcare story for a position-size rule
Imagine 10% of a portfolio in a hypothetical +3× healthcare product. Initially, that sleeve represents roughly 30% of portfolio capital in benchmark exposure. Add any healthcare exposure in broad index funds and any individual holdings before deciding how concentrated the portfolio is.
The estimate changes as the portfolio and fund move. It is a starting point for risk analysis, not an assurance that a fixed dollar hedge or allocation will remain constant.
A comparison that separates the sector from the leverage
Compare the healthcare benchmark with a broad equity benchmark first. Then compare the leveraged implementation with an unleveraged healthcare alternative over exactly the same dates, including distributions and expenses. This two-step approach shows whether a result came from sector selection or the daily leverage path.
Check current issuer documents for costs and derivative risks. A long historical chart should also explain corporate actions and use consistently adjusted data. Past resilience in one recession cannot establish protection against every future sector event.
What this means for a long-term investor
Healthcare exposure can be part of a diversified portfolio without requiring a daily leveraged product. If CURE is being considered, write down its role, the monitoring process, allocation limit and effect of a severe loss on essential goals.
Continue with ETF vs individual-stock risk and why backtests are not forecasts. The Japanese CURE companion discusses the original product.
Objective checked October 14, 2026. Numerical scenarios and diagrams are original hypothetical calculations by Y-bow, not actual CURE performance or medical claims.





Comments