
Buying an ETF and buying an individual stock both put money at risk. The difference is how much of your result depends on one business—and how much work you want to do to understand that business.
It is tempting to choose the investment with the best recent chart. A more useful starting point is the job the investment must do. Is this the core of a retirement portfolio, a small position for learning, or a deliberate view on a company? The same investor can reasonably use different tools for different jobs.
What you own in each case
A share represents an interest in one company. A conventional equity ETF holds a portfolio under an investment mandate; the fund may follow an index or use active management. The letters ETF describe a vehicle, not a guarantee of broad diversification. A sector ETF, a single-stock leveraged ETF and a total-market ETF are very different investments.
The SEC's introduction distinguishes investment vehicles and explains why asset allocation and diversification matter. Investor.gov: introduction to investing.
| Question | Individual stock | Broad equity ETF |
|---|---|---|
| Main research task | One company's finances and valuation | Mandate, holdings, weighting and costs |
| Company-specific failure | Can dominate the position | Usually spread across holdings |
| Market-wide decline | Still exposed | Still exposed |
| Ongoing fund expense | No fund expense ratio | Depends on the fund |
| Control of holdings | You choose each company | The fund's rules determine holdings |
Diversification in dollars, not in names
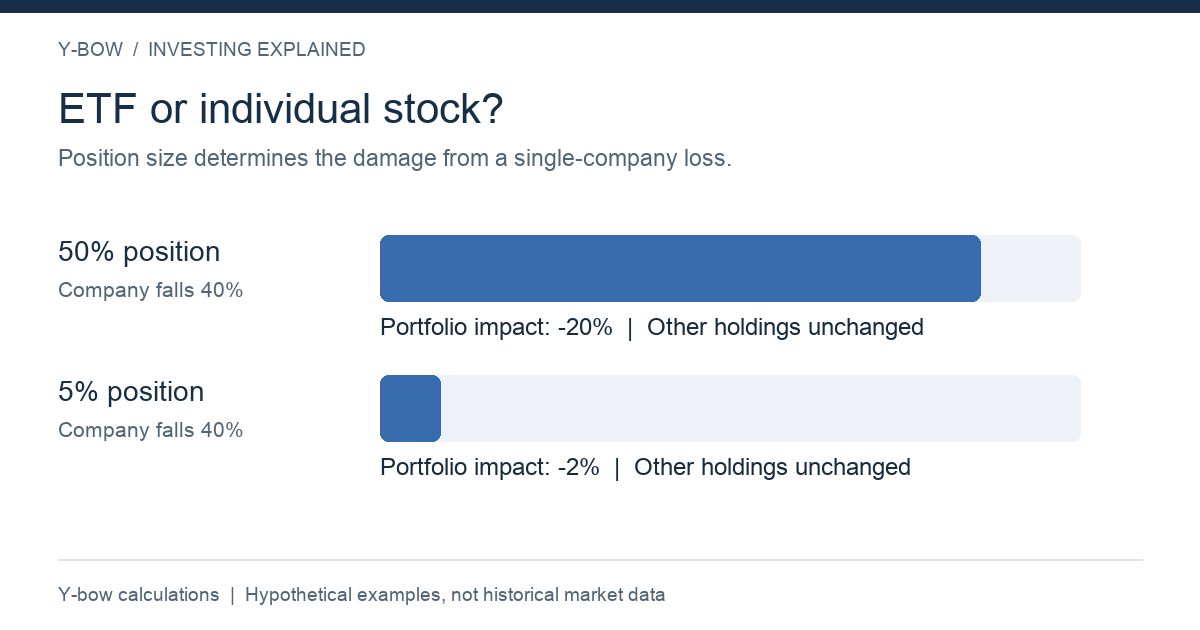
Take a hypothetical $10,000 portfolio. If one company is 50% of it, a 40% fall in that company alone removes $2,000, or 20% of the whole portfolio. If the company is 5%, the same isolated fall removes $200, or 2%. This is arithmetic, not a prediction that other holdings will stay unchanged.
That last qualification matters. In a recession, many holdings can fall together. Diversification can reduce the damage from one company without removing market risk. It is also possible for a fund with hundreds of holdings to have substantial exposure to just a few of them.
Adding five ETFs can make this problem harder to see. If all five hold the same large companies, the number of tickers has increased while the underlying exposure has barely changed. Look through the wrappers and calculate combined weights.
Individual stocks can outperform—and underperform
There is no mathematical rule preventing an individual stock from beating a broad fund. The difficulty is identifying it in advance, paying a sensible price, holding an appropriate size, and knowing when the original business thesis has changed. Knowing that a company makes excellent products is not the same as knowing its shares are attractively priced.
An index fund, meanwhile, can lag a concentrated winner for years. Its advantage is not that it wins every contest. It gives you a repeatable way to hold a defined market exposure without correctly selecting a small set of future winners.
For stock selection, write a short thesis before buying: what drives sales, what supports margins, what could undermine cash flow, and what valuation already assumes. If the thesis is just “everyone uses this product,” there is more research to do.
Fees are only one part of the comparison
A $10,000 holding with an annual expense ratio of 0.20% has an initial annual fund-cost scale of about $20. That number is illustrative; actual fees accrue on changing assets. Brokerage charges, spreads, currency conversion and taxes can also matter. Frequent trading can overwhelm a small difference in expense ratios.
Compare investments on the same basis: total return with distributions accounted for, the same currency, and the same start and end dates. A price-only chart can make an income-oriented investment look worse than it really was. A dividend yield alone can make it look safer than it really is.
Build a core before adding experiments
One possible learning process is to establish a diversified core, then keep any individual-stock research positions within a separate, limited budget. This is a way to separate learning from essential financial goals, not a universal percentage allocation.
Before adding a position, ask whether its complete loss would change your housing, education or retirement plans. If so, the position is too important to treat casually. The best investment structure is one you can understand, fund and maintain when headlines are unpleasant.
Related reading
Explore the English article collection for fund comparisons and portfolio concentration. The Japanese companion presents the original topic.
Reviewed October 14, 2026. Examples and comparison table: Y-bow. Fund availability, account rules and taxation differ by country.
Continue with Diversification Explained: Count Risks, Not Just Funds and VT, VTI and VOO: When More ETFs Mean More Overlap.





Comments