
Buying five famous technology companies can feel like diversification. But five company names are not five independent sources of risk. Cloud spending, digital advertising, consumer demand and expectations about artificial intelligence connect businesses that look different on the surface.
The old acronym GAFAM refers to Google, Amazon, Facebook, Apple and Microsoft. The listed parent companies of Google and Facebook are Alphabet and Meta. Rather than treating the acronym as a permanent investment recommendation, use it as a starting point for understanding what you actually own.
What do the five companies sell?
These are business descriptions, not a ranking of current investment attractiveness. Segment names and reporting can change, so check the companies' filings before making a comparison.
| Company | Important economic engines | Questions for an investor |
|---|---|---|
| Alphabet | Advertising, subscriptions and cloud services | How do search, distribution costs and AI investment affect profits? |
| Amazon | Retail, third-party services, advertising and AWS | Which activities generate cash after logistics and investment? |
| Meta | Advertising across its apps; investment in Reality Labs | Can monetization cover new infrastructure and product spending? |
| Apple | Devices and services across an installed user base | How durable are replacement demand and service economics? |
| Microsoft | Business software, cloud and other computing products | How much growth becomes cash after infrastructure spending? |
A cloud business and an advertising business do not have identical economics. Even within one company, a high-growth division can coexist with a mature division or a loss-making investment. A consolidated revenue headline hides those differences.
A strong business can still be an expensive stock
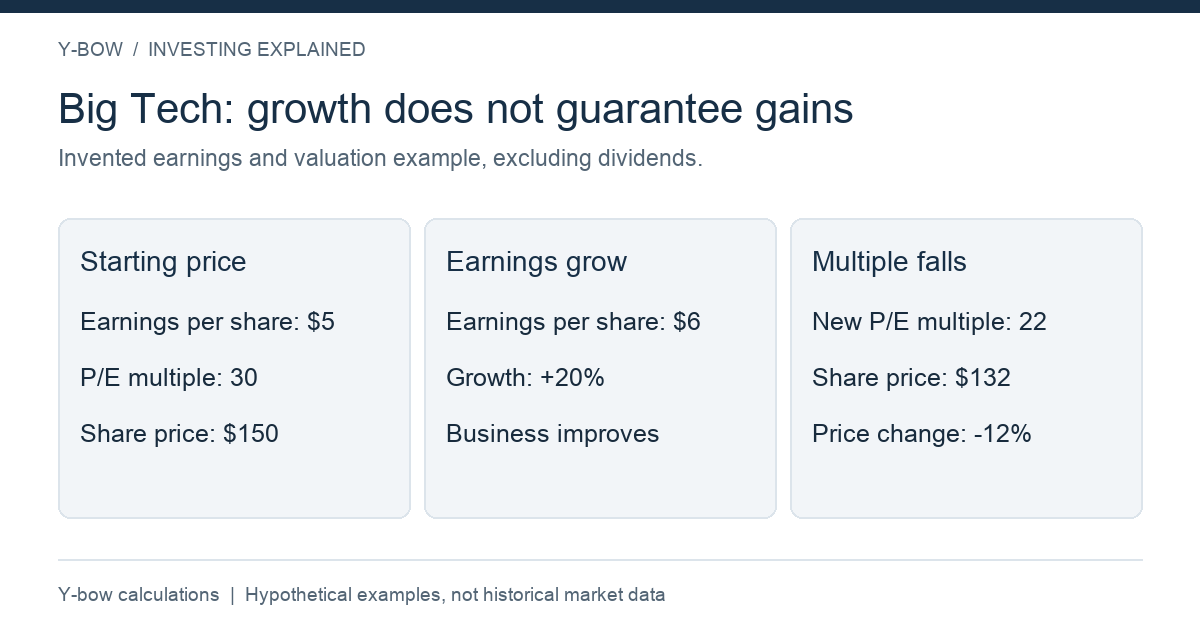
Suppose an invented company earns $5 per share and trades at $150. Its price-to-earnings ratio is 30. Earnings then rise 20% to $6, but investors now pay 22 times earnings. The resulting price is $132, a 12% decline despite profit growth. This illustration excludes dividends, share-count changes and other valuation methods.
That is why “AI demand is growing” does not finish the investment case. You also need to ask how much growth is already reflected in the purchase price. A forecast that sounds exciting can disappoint investors if the market expected even more.
Compare free cash flow with accounting earnings, and read how management defines any adjusted measure. Infrastructure payments, depreciation, stock-based compensation and working capital can make two seemingly similar growth rates mean different things.
How much Big Tech is already in your ETFs?
Buying a large-cap index ETF and then adding several of its largest constituents increases their effective portfolio weights. It does not create a separate source of diversification merely because you used a different brokerage order.
For an invented example, assume 70% of a portfolio is in a fund with a 30% exposure to a chosen company group. Another 20% is in a second fund with 45% exposure to that group, and 10% is invested directly in it. Combined exposure is 70% × 30% + 20% × 45% + 10% = 40%. These are assumed weights, not current index holdings.
Use actual dated holdings for your own calculation. The same company can appear under different share classes, while fund holdings and index weights change. Our ETF overlap guide explains the portfolio-level calculation.
Three useful checks before adding a position
First, write down the business reason. Identify the source of revenue, the competitive advantage you expect to last, and what would invalidate that expectation. A familiar brand is not a complete investment thesis.
Second, separate the company from the price. Record the valuation assumptions needed for your expected return. Do not compare earnings multiples without considering business mix, cyclicality and the quality of the earnings.
Third, set a concentration limit before the next headline. Decide whether direct stock ownership offers something your existing funds do not already provide. Compare the consequences of a company-specific loss with those of a broad market decline in our ETFs versus individual stocks article.
The point is not to predict the next acronym. It is to understand the companies behind the label and the expectations embedded in their prices. This article adapts the Japanese GAFAM discussion for international readers.
Sources and review date
Business descriptions were checked on October 14, 2026 against Alphabet's 2024 annual report, Amazon's Q2 2025 results, Meta's full-year 2025 results, Apple's FY2025 financial statements and Microsoft's FY2025 Q4 release. These references describe business models, not a synchronized latest-quarter dataset. Numerical examples are original, hypothetical educational calculations, not company forecasts.





Comments