
A ranking of the world's largest companies is a striking picture of economic power. It is also a snapshot of market prices, exchange rates and a particular definition of size. Reading it well requires more than recognizing the companies at the top.
Rather than freeze an old top-100 table and present it as current, this guide explains how to interpret any ranking—and what the ranking cannot tell you about an investment.
Market capitalization is price multiplied by shares
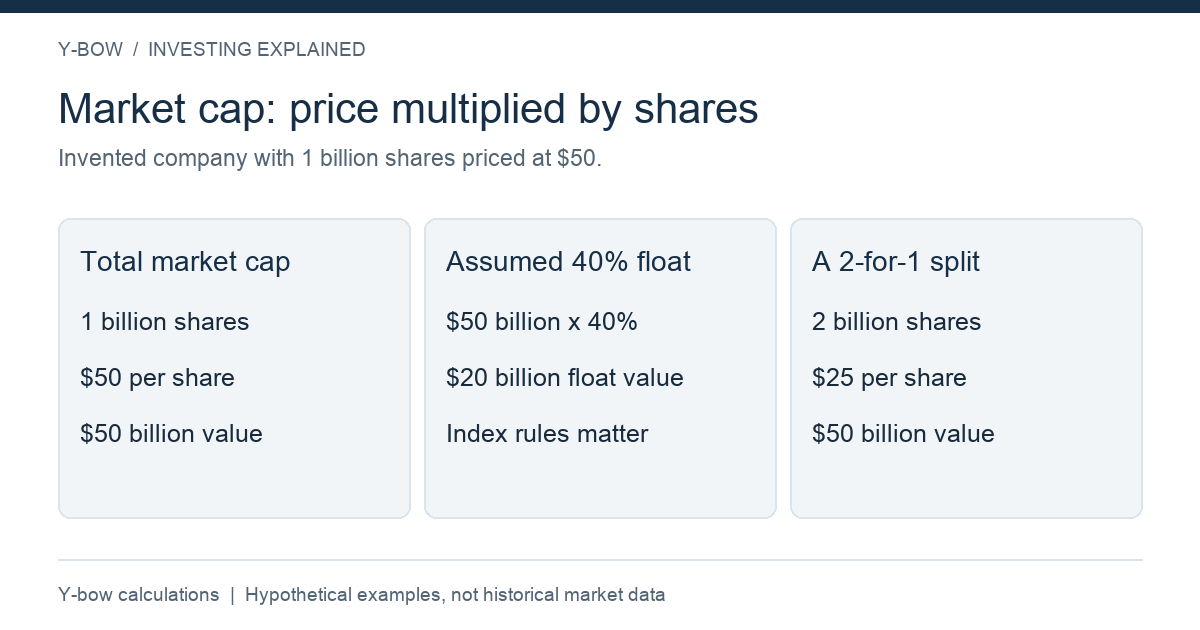
Market capitalization is calculated as the market price per share multiplied by outstanding shares. That definition is also given by the SEC's investor education site. Investor.gov: market capitalization.
For a hypothetical company with one billion shares at $50, the market cap is $50 billion. If the price rises to $60 with the same share count, it becomes $60 billion. The company's rank may change even if it did not build a new factory or increase revenue that day.
| Measure | Simplified meaning | Why it can differ from market cap |
|---|---|---|
| Market capitalization | Market value of outstanding equity | Depends on share price and share count |
| Revenue | Sales over a period | Does not measure ownership value or profit |
| Enterprise value | Equity value adjusted for debt, cash and other claims | Includes financing structure |
| Free-float market value | Equity value considered available for public trading | Excludes defined non-floating holdings |
Enterprise-value definitions can include further adjustments; verify the provider's method. A comparison using different definitions is not a fair ranking.
Currency alone can move a global ranking
Imagine a company valued at €100 billion. At $1.10 per euro, its dollar value is $110 billion. At $1.00, it is $100 billion, even if its local-currency market value is unchanged. A ranking expressed in dollars blends equity movements and currency movements.
Record the valuation date, currency and share-count basis. Beware of comparisons combining one company's current price with another company's older share count. Different market closing times can also affect a supposedly simultaneous global snapshot.
Outstanding shares are not necessarily the tradable float
A strategic shareholder can own a large stake that is included in total market capitalization but treated differently by an index's free-float rules. Suppose a $100 billion company has an illustrative 40% free-float factor. Its float-adjusted value would be $40 billion under that simplified assumption.
The example is not a calculation for a real index member. Index providers determine eligibility and free-float treatment under specific methodologies. The distinction helps explain why the world's largest company by total market cap need not have the same proportional weight in every index. S&P's explanation of float-adjusted indices.
A large company is not automatically a cheap investment
Size says little about the return available from today's price. If investors expect strong growth, the valuation can already reflect that expectation. A business may keep growing while its shareholders experience a disappointing return because the price paid was too demanding.
Compare the market value with the business's earnings, cash generation, debt and investment requirements. A revenue ranking cannot establish profitability. A market-cap ranking cannot establish a margin of safety.
A stock split does not make the company smaller
In a hypothetical two-for-one split, one share at $100 becomes two shares at $50. With all else equal, the shareholder's value and the company's market cap are unchanged. A buyback is different: cash leaves the company, share count changes and valuation can respond. It should not be analyzed as a split or as an automatic increase in total company value.
When using rankings to study change over time, keep corporate actions and methodology changes in view. Otherwise, a mechanical adjustment can be mistaken for an economic event.
Use the ranking to choose a question
If one business has become much larger than peers, ask what earnings expectations, competitive advantages and capital requirements support that value. If one sector dominates, calculate how much exposure you already have through index funds. Do not treat a top-100 graphic as a ready-made portfolio.
Continue with index construction and overlap and the Buffett Indicator's limitations. The Japanese company-ranking companion provides the original discussion.
Reviewed October 14, 2026. All numerical examples are hypothetical Y-bow calculations. This article intentionally does not present an undated company ranking as current data.





Comments