
A quarterly dividend falls. Is the fund in trouble? A yield rises. Is it suddenly a better investment? Neither question can be answered from one number without understanding its definition.
SPYD is an equity fund with a dividend-focused index. Its distributions can support an income plan, but they are not a guaranteed salary and they do not tell you the entire investment return. This guide separates fund payments, yield measures and portfolio value.
What SPYD is designed to hold
SPYD tracks the S&P 500 High Dividend Index. The issuer describes the index as selecting the top 80 high dividend-yielding companies in the S&P 500. The fund distributes quarterly, but actual holdings and payment amounts can change. State Street SPYD.
The selection rule is not an instruction to buy the highest-yielding stock you can find. A portfolio built around a dividend criterion can have sector concentrations and can perform differently from a broad market fund.
Three yield measures can give three answers
An indicated yield may annualize a recent payment. A trailing distribution yield uses actual payments over a past period. A standardized income yield uses its own defined calculation. Read the label and methodology on the issuer page rather than assuming that every “yield” means the same thing.
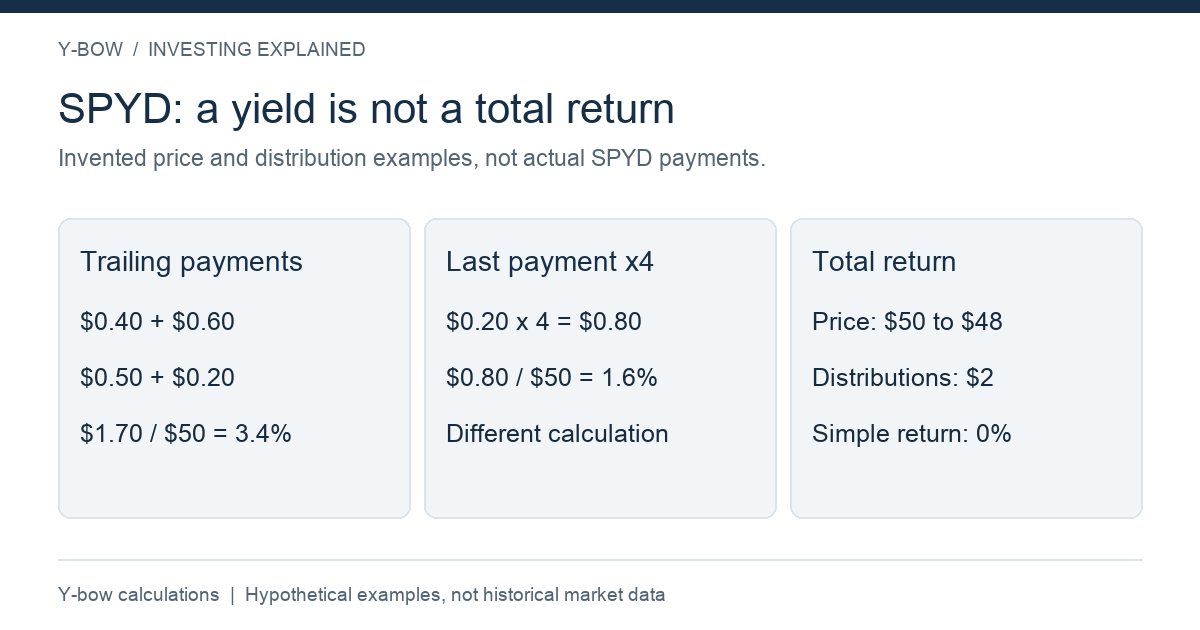
Here is a hypothetical fund priced at $50, paying quarterly distributions of $0.40, $0.60, $0.50 and $0.20. The year's payments total $1.70, or 3.4% of that price. Annualizing only the last payment gives $0.80, or 1.6%. Both calculations are arithmetically valid; they describe different measures and neither guarantees next year's payment.
| Hypothetical calculation | Amount used | Yield at $50 |
|---|---|---|
| Last four quarterly payments | $1.70 | 3.4% |
| Last payment multiplied by four | $0.80 | 1.6% |
This explains why one weak quarter can make an annualized display look dramatically lower. It does not establish that a weak payment is harmless. Check the actual distribution history and the underlying businesses before drawing a conclusion.
A distribution is not free additional wealth
Suppose a fund starts at $50, finishes at $48 and pays $2 in distributions during the period. Its simple return, with the distributions held as cash and before taxes, is 0%: ($48 + $2 − $50) ÷ $50. A headline 4% payment rate did not prevent a fall in the fund's price.
A reinvested total-return series uses a different, more detailed calculation because each distribution buys additional shares at a particular price. When comparing funds, keep distribution treatment consistent. A price chart and a reinvested total-return chart are not interchangeable.
Higher yield can mean a lower share price
A $2 annual payment divided by $50 gives 4%. The same payment divided by $40 gives 5%. The yield rose even though the assumed cash payment did not. A price decline can signal changing expectations or financial stress, so a higher displayed yield is not automatically good news.
Dividends can be reduced. Diversification spreads company-specific risk, but multiple companies can face pressure at the same time. Do not turn a high-dividend strategy into a principal-protection claim.
Plan spending around uncertain income
If distributions fund living costs, model a payment reduction and a share-price decline together. For a hypothetical 1,000-share holding, reducing annual distributions from $2 to $1.50 lowers cash income from $2,000 to $1,500. If the investor needs the original amount, the shortfall must come from cash, other income or selling shares.
Taxes and withholding depend on residence and account type. Reinvestment can compound exposure, but it does not make tax or risk disappear. Keep the household cash-flow plan separate from a fund's attractive yield headline.
Compare income strategies by the job they perform
Check current holdings, sector concentration, expenses, distribution history and total returns. Compare the fund with alternatives over common dates. Ask whether you need current cash income, long-term total return, or a combination—not which product has the largest number beside “yield.”
Continue with QYLD and XYLD: yield versus total return and ETF versus individual-stock risk. The Japanese SPYD companion covers the original topic.
Objective and distribution framework checked October 14, 2026. All numerical examples are hypothetical Y-bow calculations, not actual SPYD payments or a forecast.





Comments