

Six tickers can look like six versions of the same trade. YINN, LABD, FAS, TNA, DRN and EDC all involve daily leverage, but they do not bet on the same market—or even the same direction.
That last point is easy to miss. LABD is a bearish biotechnology fund. LABU is the bullish counterpart. Confusing one letter changes the intended exposure from a rising market to a falling one.
Before comparing a performance chart with TQQQ or another successful fund, identify the benchmark, direction and reset period. Those three details explain more than the word “leveraged” on its own.
Six leveraged ETFs: benchmark and direction
The following objectives were checked against Direxion’s official product listing on October 15, 2026. Each multiplier refers to a single trading day, before fees and expenses. It is an objective, not a guaranteed result. Source: Direxion.
| Ticker | Benchmark | Daily objective | Main exposure to understand |
|---|---|---|---|
| YINN | FTSE China 50 Index | +300% | Large, liquid Chinese shares listed in Hong Kong |
| LABD | S&P Biotechnology Select Industry Index | −300% | A bearish position on the biotechnology benchmark |
| FAS | Financial Select Sector Index | +300% | U.S. financial-sector shares |
| TNA | Russell 2000 Index | +300% | U.S. small-cap shares |
| DRN | Real Estate Select Sector Index | +300% | U.S. listed real-estate-sector shares |
| EDC | MSCI Emerging Markets Index | +300% | Emerging-market equities across multiple countries |
YINN is not a leveraged version of every Chinese share market. Hong Kong-listed constituents differ from a broad mainland A-share portfolio. Likewise, a U.S. real-estate equity fund is not a direct holding in a rental property. Index membership and weighting determine what the investor actually receives.
Benchmarks can change. FAS, for example, moved to the Financial Select Sector Index in 2022. A long chart may therefore span different benchmark definitions. Read the dated prospectus and change notices before attributing the whole record to today’s index. Source: Direxion benchmark-change notice.
LABD versus LABU: the sign matters
An idealized +3x product targets a positive return when its benchmark rises that day. An idealized −3x product targets a positive return when the benchmark falls. They are not two interchangeable ways to invest in biotechnology.
If the index rises 10% in one day, the simplified +3x calculation is +30% and the −3x calculation is −30%. Actual fund outcomes can differ because of costs and tracking. Neither statement says what happens over several days.
The issuer presents LABU and LABD as bull and bear products on the same benchmark. Check the full name, not just a remembered ticker. Source: Direxion biotechnology funds.
Daily compounding: a bull and bear fund can both lose
Start the index and two frictionless daily-reset models at 100. Multiply each day by 1 + r for the index, 1 + 3r for the bull model and 1 − 3r for the bear model. These are hypothetical calculations, not fund performance.
| Two-day index path | Index ending value | Daily +3x model | Daily −3x model |
|---|---|---|---|
| +10%, then +10% | 121 | 169 | 49 |
| +10%, then −10% | 99 | 91 | 91 |
| −10%, then −10% | 81 | 49 | 169 |
In the middle row, both leveraged models lose 9%. Holding equal dollar amounts of a bull and bear fund does not create a costless hedge or a reliable cash substitute. Expenses and financing would add further considerations.
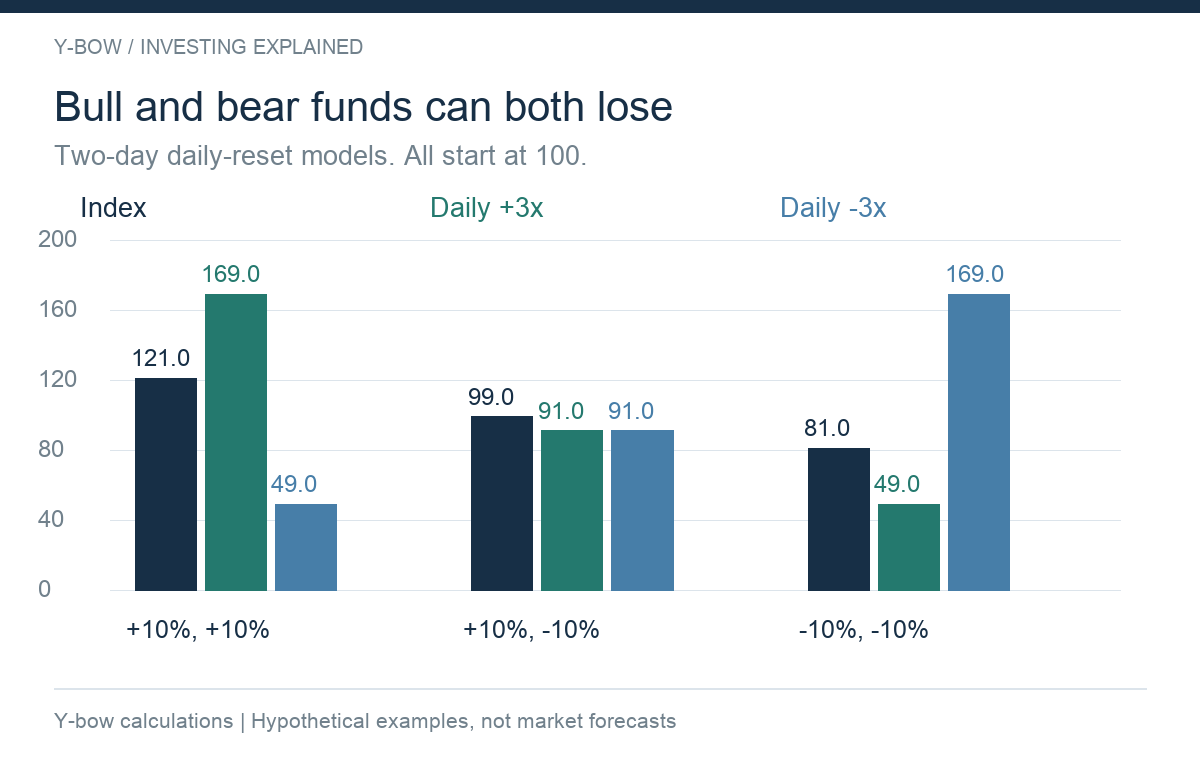
The example also shows why a bearish fund’s multi-day return is not simply the negative of a bullish fund’s return. Each compounds from its own changing balance. The SEC warns that longer holding periods can produce results very different from the advertised daily multiple. Source: SEC.
Industry, country and small-cap risk do not disappear with leverage
YINN and EDC have different country concentrations. EDC includes multiple emerging markets, but diversification does not remove currency, policy, governance or market-access risk. A dollar trading price does not mean the underlying businesses have no foreign-currency exposure.
FAS depends on financial businesses, whose earnings can react differently to interest rates, credit losses and funding conditions. TNA holds small-cap exposure rather than a scaled-down Nasdaq portfolio. DRN is sensitive to listed property companies, financing costs and equity-market sentiment. Biotechnology can react sharply to research results, financing needs or regulatory decisions.
These are reasons to examine the holdings and the investment case, not predictions that one group must outperform. Daily leverage amplifies the path of the selected benchmark; it does not fix a weak benchmark choice.
Why “TQQQ won the chart” is not a selection rule
A chart beginning before a strong period for large growth companies can make TQQQ look like the obvious winner. That is a description of that window. It is not evidence that every other leveraged market is permanently inferior.
For a fair comparison, align start and end dates, dividends, splits, expenses and currency. Include products that closed, not just survivors. Keep any pre-inception simulation separate from actual fund returns. Compare drawdowns and recovery requirements as well as final wealth.
Different benchmarks also answer different questions. A bearish biotechnology trade should not be judged as though its purpose were a decades-long bullish U.S. growth allocation. First define what the position is intended to do, then ask whether the data support that use.
Position size is part of the product risk
Suppose 10% of an otherwise unchanged portfolio is in a fund that falls 60%. The direct portfolio effect is approximately −6%. If the same position is 50%, it is approximately −30%. These are simple contribution calculations, not estimates of a likely fund loss.
The remaining assets may fall at the same time. Multiple leveraged holdings can share exposures even when their ticker labels differ. Check the portfolio’s look-through holdings, financing and cash needs rather than counting funds as separate sources of safety.
Also consider execution. Bid-ask spreads, order size, market hours and the underlying markets affect the price you receive. International investors must check local access rules, taxes and product documentation; a U.S. ticker alone is not proof of eligibility.
A checklist before comparing or trading
Write down the exact ticker, current benchmark, bull or bear direction, daily target, intended holding period and maximum affordable loss. Read the prospectus for expenses, derivatives, financing and extraordinary market risks. Decide how you would review or exit the position before a volatile day forces the decision.
For a broader introduction, see how investment leverage works. For a semiconductor-specific example, see SOXL’s daily target and drawdown risk.
The useful comparison begins with what each fund owns and targets. The multiplier comes afterward.
Information checked October 15, 2026. Product objectives can change. Hypothetical models exclude fees, financing, tracking differences, taxes and currency changes. This is an explanation of mechanics, not a recommendation to trade these products.








Comments