

A new AI data center is announced. The headline says a gigawatt. Another company reports a record backlog for electrical equipment. It is tempting to connect the dots: more AI, more electricity, higher profits, higher share prices.
The first connection may be reasonable. The last three need work. Power demand, equipment orders, corporate earnings and investment returns measure different things. This guide explains how to follow the chain without treating every proposed megawatt as a paying customer.
We will separate power from energy, compare forecasts without mixing their assumptions, calculate the effect of cooling efficiency, and examine why a growing business can still be a disappointing investment. The examples apply across markets; they do not depend on Japanese tax accounts or a particular broker.
Sources checked October 16, 2026. Future demand figures are projections, not observed consumption or stock-price forecasts. Numerical company examples are hypothetical.
The short answer
- The constraint is often getting reliable power to a particular site on time, rather than a global shortage of electricity.
- Announced or requested capacity is not the same as operating load.
- A compelling AI infrastructure story still needs contracts, margins, cash flow and a reasonable purchase price.
How much electricity will AI data centers use by 2030?
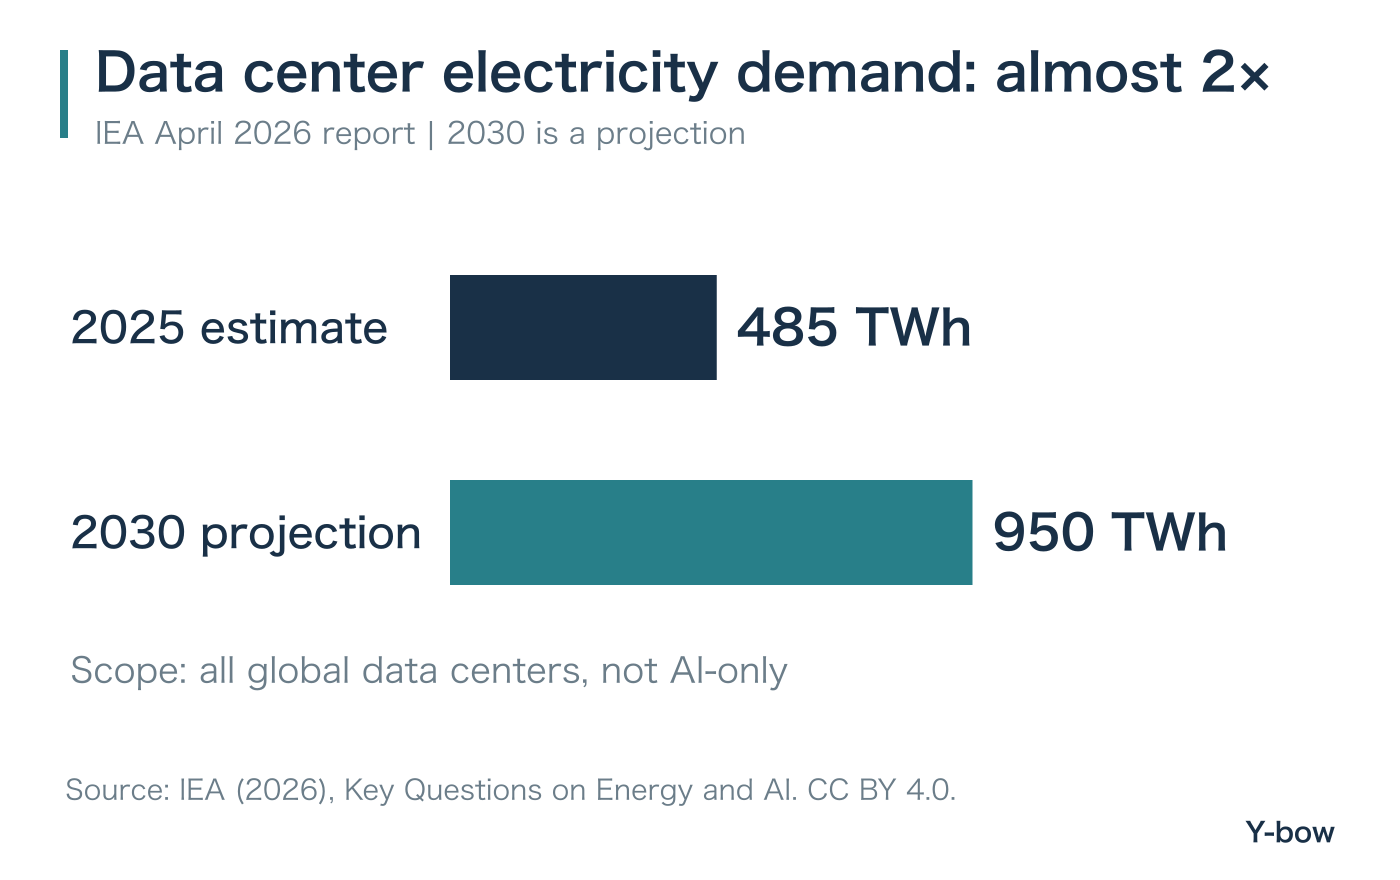
The IEA’s April 2026 report, Key Questions on Energy and AI, projects global data center electricity consumption rising from 485 terawatt-hours in 2025 to about 950 TWh in 2030, approximately 3% of global electricity demand.
That is a forecast for all data centers, not just AI facilities. It is also a comparison across five years: approximately 1.96 times the starting level does not mean demand doubles every year. The distinction matters when a short social post turns a qualified forecast into an alarming claim.
Why a U.S. forecast cannot simply be divided by a global forecast
There is a newer U.S. reference worth reading: Lawrence Berkeley National Laboratory’s United States Data Center Energy Usage Report: 2025 Update, published June 18, 2026. Despite its title, this is a 2026 publication.
| Source and scope | Starting estimate | Future result |
|---|---|---|
| IEA: global data centers | 485 TWh in 2025 | About 950 TWh in 2030 |
| LBNL: U.S. data centers | 192 TWh in 2024; 4.7% of U.S. consumption | 649 TWh in the 2030 Reference Case; 11.8% |
| LBNL: compounded uncertainty scenarios | Changes to the U.S. model’s assumptions | 521–843 TWh in 2030; 9.5–15.3% |
Dividing 649 by 950 does not establish a reliable U.S. share of global consumption. These are independent modeling exercises, not a single internally consistent forecast. Nor is LBNL’s uncertainty range a 95% confidence interval or a set of stock-return probabilities. Use each forecast within its own framework.
MW vs MWh: what does a 100 MW data center actually mean?
Megawatts and gigawatts describe power or capacity. Megawatt-hours and terawatt-hours describe energy over time. A useful analogy is the flow rate from a tap versus the volume collected in a tank.
- 1 GW = 1,000 MW.
- 1 TWh = 1,000 GWh = 1,000,000 MWh.
- Annual energy = average power × hours; a non-leap year has 8,760 hours.
A whole facility drawing an average 100 MW for a year consumes 876,000 MWh, or 0.876 TWh. A request for a 100 MW connection does not tell us that the facility draws 100 MW on average. Servers may arrive in phases, customer workloads may ramp slowly, and the requested connection can include headroom.
IT capacity and total facility capacity are different boundaries
If 100 MW describes the servers and other IT equipment, cooling and electrical overhead must be added. If it already describes the whole facility, adding that same overhead again is double-counting.
Power usage effectiveness, or PUE, is total facility energy divided by IT equipment energy. At PUE 1.3, every unit consumed by IT equipment corresponds to 1.3 units for the facility. The extra 0.3 includes cooling and other overhead; it is not necessarily all cooling.
Data center PUE: calculate cooling and power overhead before quoting savings
Consider an illustrative facility with 100 MW of maximum IT load and an annual average electrical load of 70 MW. That is an assumed 70% electrical load factor, not a claim about GPU computational utilization. IT energy is 70 × 8,760 = 613,200 MWh, or 613.2 GWh.
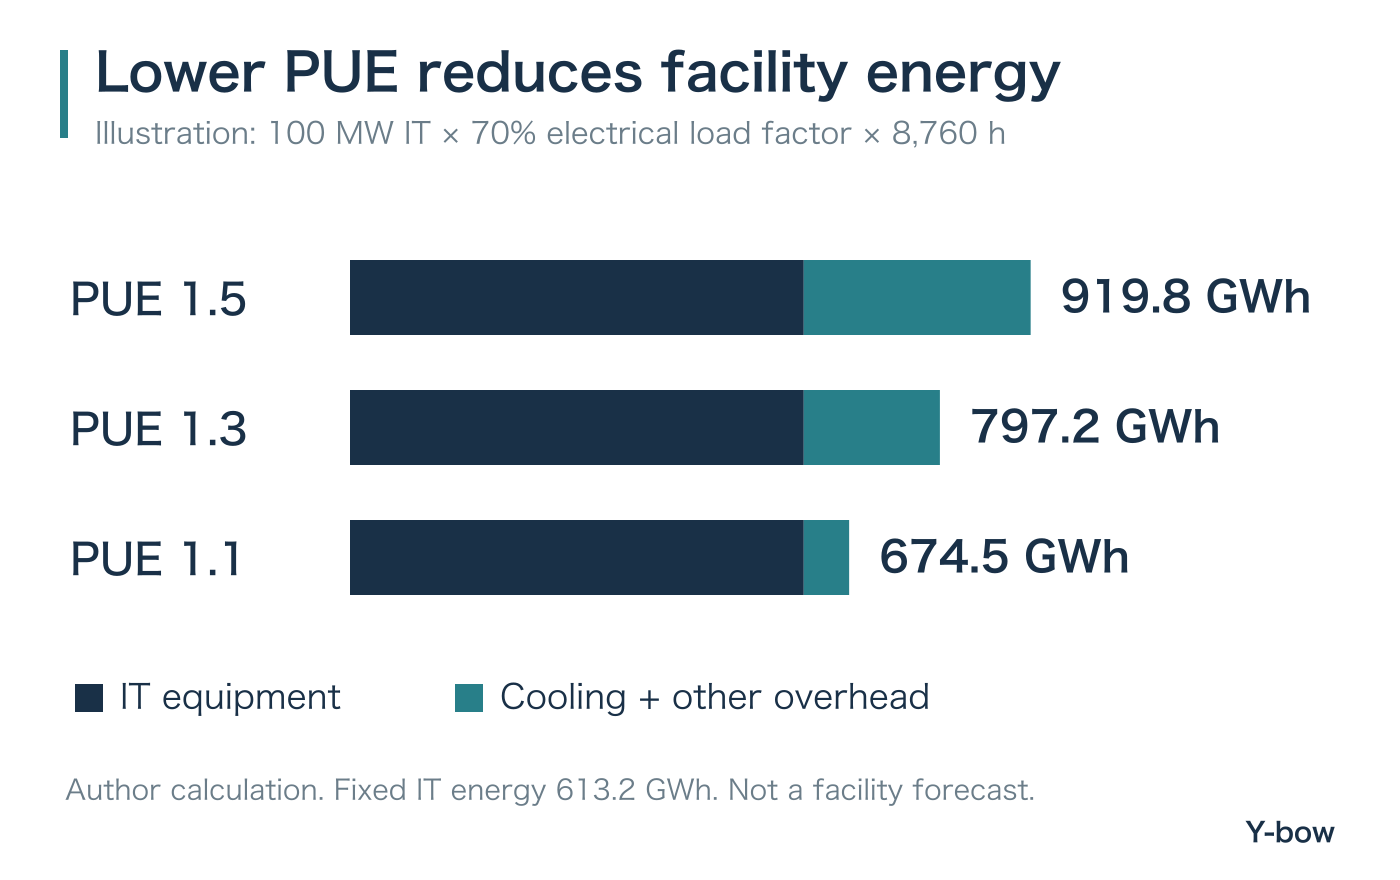
Moving from PUE 1.5 to 1.1 saves 245.28 GWh annually in this example: approximately 26.7% of total facility energy. Overhead energy alone falls 80%, but the whole facility does not use 80% less electricity. Both calculations can be correct; the denominators differ.
For a real reference, Google reports a 2025 annual fleet-wide PUE of 1.09. That is its reported operating performance, not a universal assumption for new facilities. Climate, loading, equipment and measurement boundaries matter.
PUE also does not measure useful work per kilowatt-hour. A facility can have excellent PUE while running inefficient software or underused servers. To evaluate an AI service, you would also want a defined workload and output quality.
Will more efficient AI reduce total electricity demand?
It can reduce energy per task without reducing total energy. If energy per task halves and the number of tasks triples, aggregate energy rises 50%. This is arithmetic under stated assumptions, not a prediction for a particular model.
Training and inference should also be separated. Training builds a model; inference uses it. A short text reply, a lengthy reasoning task and video generation are not interchangeable units of “one AI query.” A per-query figure needs a model, workload, output length and measurement boundary before it becomes informative.
The AI power bottleneck: grid connections, transformers and project timing
A relatively small global share can conceal a severe local constraint. A region may have generation available somewhere, but insufficient transmission or substation capacity at the proposed site. Electricity has to be delivered at the right location and time, with an acceptable level of reliability.
The IEA’s Electricity 2026 grid chapter describes planning, permitting and completing new grids taking 5–15 years, compared with 1–3 years for data center construction. These are broad comparisons, not promised delivery dates for individual projects.
The IEA’s October 14, 2026 report, Powering Artificial Intelligence, highlights another complication: connection queues include duplicate or speculative proposals. Even a completed building can take time to fill with operating servers and customer workloads.
Follow the stages separately: proposal → connection application → contracts and financing → construction → energization → server installation → paid work. A large capital spending announcement is not evidence that the last stage has been reached.
Nuclear, SMRs, gas, renewables and batteries solve different problems
An annual electricity total does not show whether power is available overnight or during a difficult hour. Generation, transmission, storage, backup and flexible demand perform different jobs.
For nuclear or small modular reactors, ask about permitting and commercial operation dates. For gas, examine fuel access, equipment delivery and emissions constraints. For renewables, consider location and hourly output. For batteries, look at both power and duration: delivering 1 GW for one hour requires 1 GWh before accounting for losses.
A power purchase agreement is not proof that a data center has been energized. Check the supply start date, the generating asset and the contract’s scope. On-site generation also leaves questions about fuel, maintenance, redundancy and any eventual connection to the public grid.
Investing in AI power infrastructure: who captures the revenue?
There is no single “AI power stock” business model. The same demand expansion reaches companies through different contracts, costs and balance sheets.
| Business | Possible route to revenue | What to examine |
|---|---|---|
| GPU, HBM and chip suppliers | Servers installed in powered facilities | Deployment timing, inventory, customer spending and capacity |
| Transformers and electrical equipment | New connections and upgrades | Delivery schedules, cancellations, expansion costs and margins |
| Cooling and power management | Higher-density computing installations | Design wins, pricing, service revenue and competition |
| Utilities and generators | Electricity sales and infrastructure investment | Tariffs, cost recovery, regulation, capital requirements and interest costs |
| Data center operators | Selling space or computing services | Contracted versus operating capacity, power costs, customer concentration and cash |
A record backlog needs context. Can orders be canceled? When will deliveries occur? What will the new factory cost? Higher sales can coexist with weak cash flow if materials, labor and expansion spending rise first.
Utilities add another layer: regulation and tariff design determine how investment costs are recovered. More electricity sold does not automatically translate into proportionately higher shareholder earnings. Merchant generators face a different mix of contract, fuel and market-price exposure.
For semiconductor investors, a power constraint can shift deployment rather than eliminate the underlying use case. But a long delay can also damage a customer’s financing or project economics. Distinguish a temporary scheduling problem from an order that may never become revenue.
Why 25% earnings growth can still produce a falling share price
Use the simplified identity share price = earnings per share × price-to-earnings multiple. Start with EPS of 100 and a P/E of 40: the price is 4,000. If EPS rises to 125 but the multiple falls to 30, the price becomes 3,750: a 6.25% decline before dividends.
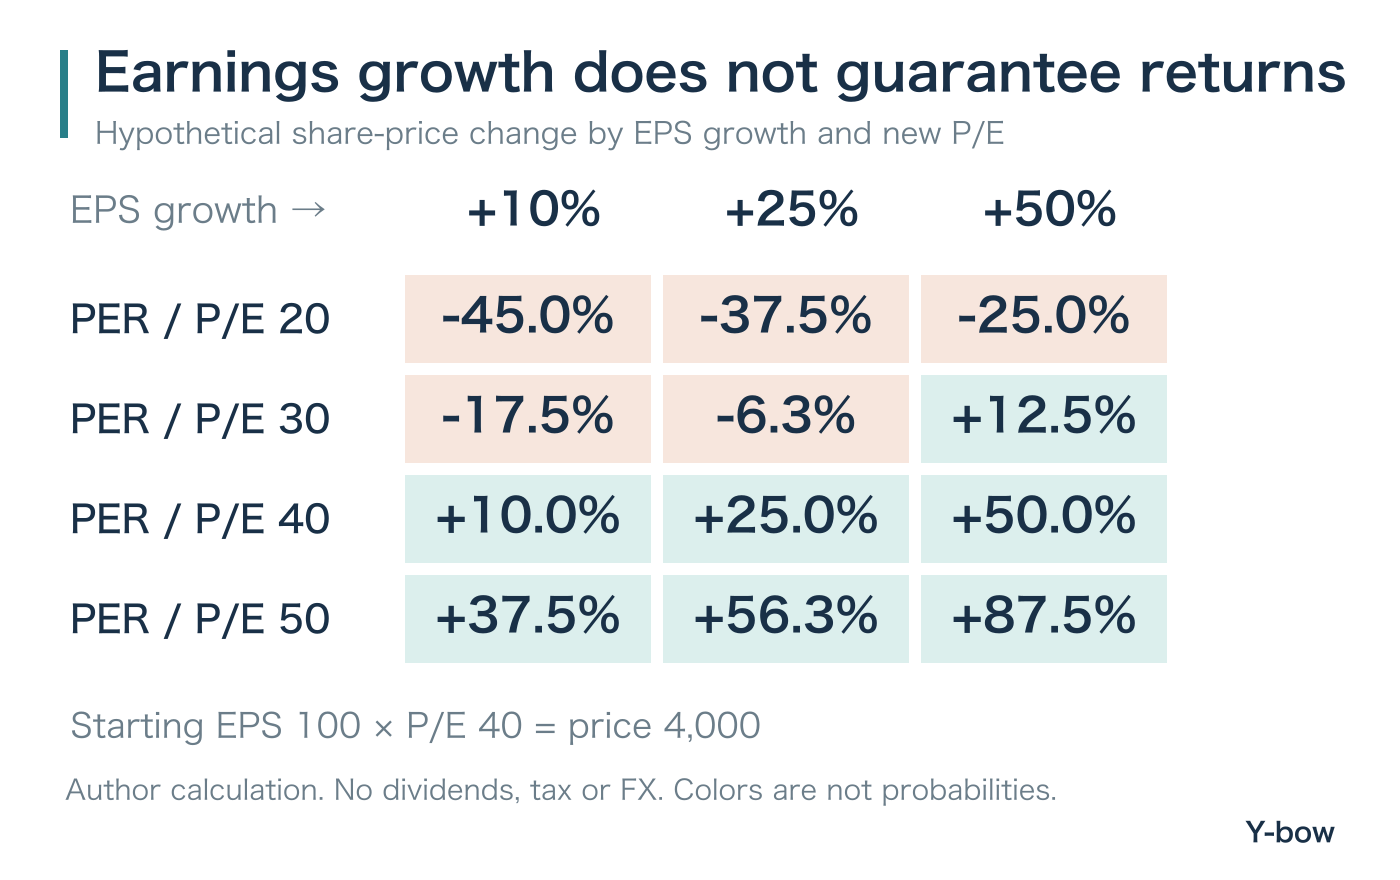
The lesson is not that growing businesses are bad investments. It is that the price paid already contains expectations. Compare earnings growth with the expectations embedded in the valuation, and check whether debt costs or new share issuance reduce the benefit per existing share.
Will data centers raise household electricity bills?
Not necessarily everywhere. The October IEA report distinguishes projects that require new assets paid for across a broad customer base from those that make fuller use of existing capacity and bear an appropriate share of costs.
Look for minimum-payment commitments, contract duration, collateral and exit provisions. They help allocate the risks of a customer using less capacity than reserved, leaving early or never connecting. An answer for one utility territory cannot automatically be applied to another state or country.
Water deserves its own boundary check. On-site cooling water and water used upstream in electricity generation are different quantities. Better PUE does not guarantee lower water use. A cooling design that saves water can, under some conditions, consume more electricity. Electricity, water and emissions should be evaluated together without treating one metric as a complete scorecard.
A five-question checklist for the next AI data center headline
- What is counted? AI-only or all data centers? Global demand or a local project?
- What is the unit? MW of capacity or MWh of energy? IT equipment or the entire facility?
- What is the stage? Application, contract, construction, energized capacity or operating load?
- Who pays? Check connections, fuel, cooling, financing and replacement costs.
- What is priced in? Follow margins, cash flow and per-share earnings, not just sales growth.
This checklist does not require dismissing AI’s potential. It helps locate where a genuine increase in activity may become durable earnings—and where a promising project still has several expensive steps to go.
AI electricity demand: frequently asked questions
Does AI use 3% of the world’s electricity?
The IEA figure cited here is a 2030 projection for all data centers. It is neither a current observation nor an AI-only total.
Does PUE 1.1 mean 90% of the electricity is wasted?
No. IT equipment uses 1 unit out of a facility total of 1.1; overhead is 0.1. PUE does not tell you how productive the IT work itself is.
Can I add up grid connection requests to estimate future consumption?
Not reliably. Requests can overlap or be canceled, and reserved capacity differs from average load. You need project maturity, loading assumptions and the measurement boundary.
Are utilities ETFs a direct bet on AI growth?
Only indirectly, and the exposure varies. An ETF’s holdings, geography, regulation and valuation matter. Electrical equipment makers, merchant generators and data center operators may sit outside a particular utilities index.
Read AI infrastructure from both ends of the power cable
Chips without usable power do not deliver compute. Powered buildings without enough paying work do not recover their investment. Following both sides produces a better question than “Which company benefits from AI?”: Which signed, funded and operating projects can generate cash at a price that justifies today’s valuation?
Continue with our guides to the semiconductor supercycle and memory-market risks, VPU, XLU and JXI utilities ETFs, and SOXL and daily leverage. New to investing? Start with the beginner’s first-month plan.
Sources and calculation notes
- IEA, Key Questions on Energy and AI, April 16, 2026. Global demand projection. CC BY 4.0.
- Smith et al., LBNL, United States Data Center Energy Usage Report: 2025 Update, June 18, 2026, report pp. 5 and 9–10. U.S. estimates and scenarios. CC BY 4.0.
- IEA, Electricity 2026 — Grids. Infrastructure timing. CC BY 4.0.
- IEA, Powering Artificial Intelligence, October 14, 2026. Queues, procurement, tariffs and sustainability. CC BY 4.0.
- Google, Power usage effectiveness. Reported 2025 PUE and measurement boundaries.
Charts are the author’s original redraws or calculations, not reproductions of the source graphics. PUE example: average IT power 70 MW, 8,760 hours, fixed PUE. Valuation example: initial EPS100, P/E40, constant shares, excluding dividends, tax and currency effects. This article provides general information, not a recommendation to trade a security.







Comments