
A neutron star combines a stellar mass with a city-sized radius. That combination makes ordinary comparisons with density feel inadequate. A pulsar and a magnetar are ways in which neutron stars can become especially conspicuous, rather than unrelated kinds of object.
This focused English adaptation of Y-bow’s article about extreme cosmic objects examines compact stars through one transparent calculation. The original diagram is an assumed spherical model, not a photograph, measurement or map of a neutron star’s interior.
One family of objects, different observational clues
NASA’s neutron-star introduction describes remnants formed when the cores of massive stars collapse. A neutron star contains an enormous amount of matter in a comparatively small region. Its detailed internal structure remains a scientific question.
A pulsar is observed through repeating pulses as a rotating beam crosses our line of sight, much like a lighthouse. The pulses do not mean the whole star is repeatedly turning on and off. Magnetars are neutron stars distinguished by particularly strong magnetic fields and energetic activity. These descriptions emphasize different features; they should not be treated as a rigid list of mutually exclusive boxes.
Calculate an average before repeating a teaspoon analogy
Choose an illustrative mass of 1.4 solar masses, with one solar mass approximated as 1.988 × 10³⁰ kilograms. That gives M = 2.7832 × 10³⁰ kilograms. Choose a radius of 12 kilometers, or 12,000 meters. Neither choice is a new observation; both are assumptions for this exercise.
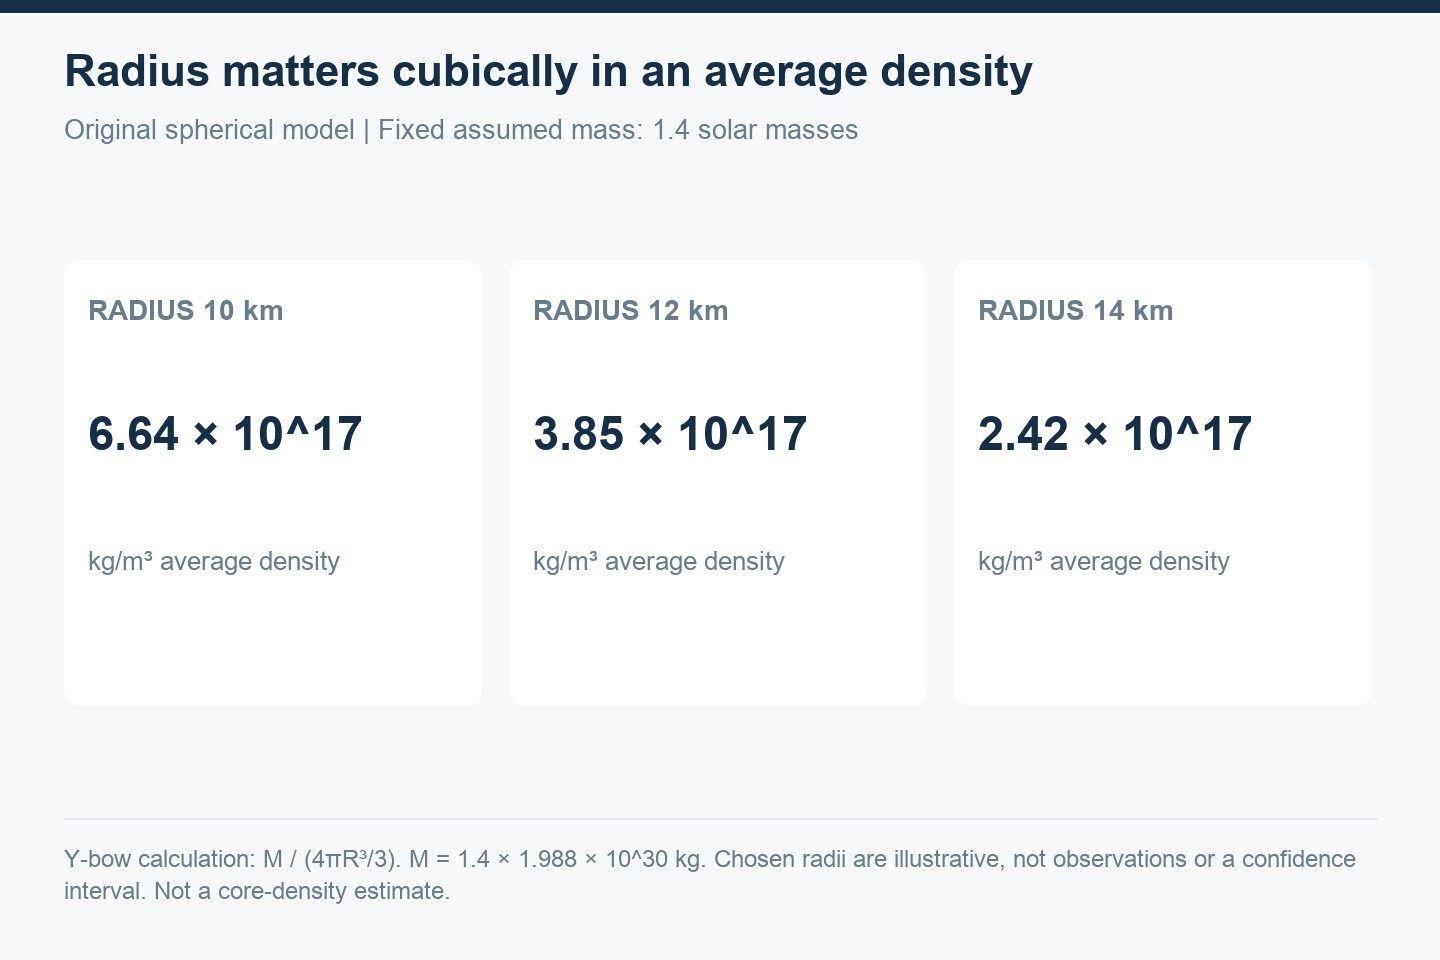
The volume of a sphere is 4πR³/3. At the assumed radius, the volume is approximately 7.24 × 10¹² cubic meters. Dividing mass by volume gives an average density of about 3.85 × 10¹⁷ kilograms per cubic meter.
A cubic centimeter is 10⁻⁶ cubic meters. Applying that volume to the average gives about 3.85 × 10¹¹ kilograms, or 385 million metric tons. The arithmetic communicates a scale. It does not establish that a stable cube could be removed, transported to Earth and weighed under ordinary conditions.
Why a small radius difference changes the answer
Keep the illustrative mass fixed and change only the radius. At 10 kilometers the calculated average density is about 6.64 × 10¹⁷ kg/m³; at 14 kilometers it is about 2.42 × 10¹⁷ kg/m³. A radius change that looks modest on a drawing has a large effect because volume depends on the cube of radius.
This is a sensitivity exercise. It is not a claim that real neutron stars all have the same mass, nor that their possible radii can be selected independently of their material properties. It shows why a density headline needs its mass, radius and definition attached.
Average density is not a description of the core
Our calculation divides the mass by a geometrical spherical volume. It does not account for the distinction between gravitational mass, local matter density and proper volume in general relativity. A physical star is not required to follow that uniform-density picture. An average cannot tell us how pressure changes with depth, which particles are present in a particular region or how matter responds to compression.
NASA’s June 5, 2025 NICER science summary describes how mass-and-radius information is combined with other constraints to study the equation of state—the relationship between pressure and density. The conclusions depend on observations and assumptions together. Our simple arithmetic does not replace that analysis.
What makes a good explanation of an extreme object?
Our interpretation is that a useful explanation separates three layers: what telescopes detect, what a physical model infers and what an analogy helps us imagine. A repeating signal is observational evidence. An internal model interprets evidence. A teaspoon comparison is a communication device. Moving between those layers without saying so makes a dramatic story appear more certain than it is.
A related distinction appears in our black-hole guide, where the event horizon, surrounding bright matter and reconstructed image have different meanings. For another example of careful physical assumptions, read time dilation and GPS.
Sources checked October 12, 2026. NASA references linked above. Spherical model, arithmetic and diagram by Y-bow; no claim of a newly measured density or interior composition. Japanese counterpart.





Comments