

Kioxia closed at ¥7,966 on November 17, 2026, down from ¥9,091 two trading days earlier. Over those same dates, investors carried an additional 2,302,100 shares in open margin longs. How can more shares remain open on margin while the price falls?
Imagine a limit order to buy a stock ¥500 below yesterday’s close. A seller accepts. If the buyer borrows to fund the purchase and leaves the position open, that trade can contribute both a lower price and a higher margin balance. The exchange report lets us measure the balance. Reconstructing who placed the orders would require different evidence.
Count the shares that stayed open
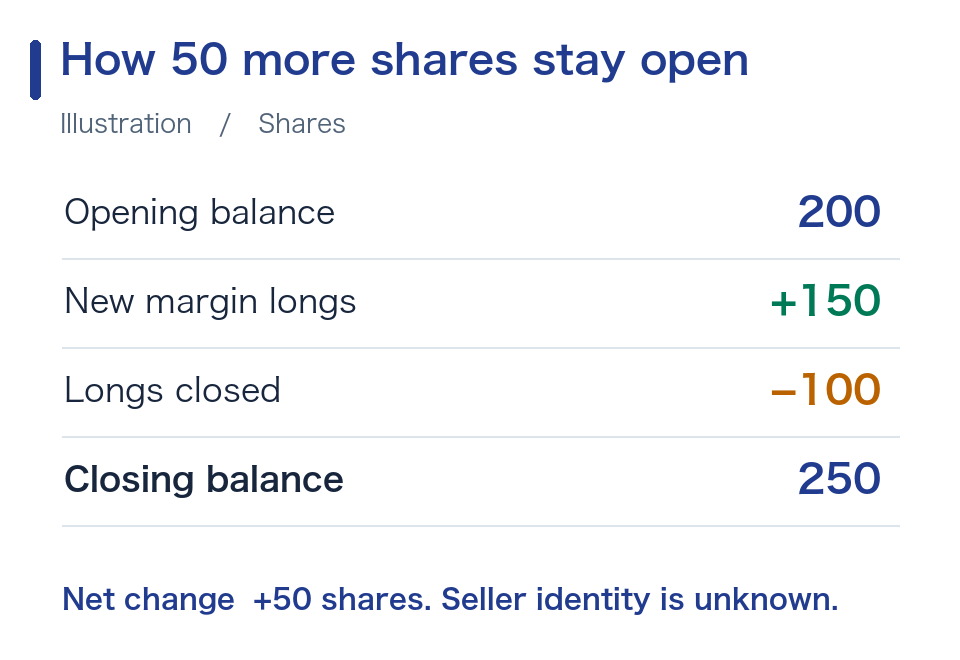
Suppose traders start with 200 shares in open long positions. They open 150 more and settle 100, leaving 250. They could have opened 550 and settled 500 for exactly the same ending balance. Neither the total trading volume nor the number of people who sold follows from the 50-share increase. Settlement can also involve taking delivery of shares rather than selling them on the exchange.
Some Japanese market commentary uses the nickname momechin, short for “momentum chimpanzee.” It is slang. A trend follower exiting as prices weaken and a contrarian buying the dip are making different decisions. The Tokyo Stock Exchange does not sort this table by trading strategy, margin calls or anyone’s intention. Sector news, revised earnings expectations and index-related flows are also possible explanations that would need evidence of their own.
How to find the right row in a Japanese margin report
Match the closing price to the application date. Then check when the report became available. The PDF published on November 17 shows positions for November 16. To compare positions with the November 17 close, use the report published on the 18th. The distinction also matters in a backtest. Traders could not have used the 18th’s release at the previous close.
| Application date | Report date | Close (¥) | Longs (shares) | Shorts (shares) | Longs ÷ shorts |
|---|---|---|---|---|---|
| 11/13 | 11/16 | 9,091 | 49,959,000 | 2,173,000 | 22.99× |
| 11/16 | 11/17 | 8,392 | 50,889,500 | 2,101,500 | 24.22× |
| 11/17 | 11/18 | 7,966 | 52,261,100 | 1,881,600 | 27.77× |
← Swipe to view the full table →
Change from November 13 to 17, 2026. The two balances rose by 2,302,100 shares in total. Source: JPX, application dates.
On page 22 of each PDF, find Kioxia Holdings Corporation, code 285A0, then read the shares row marked “Shs.” The adjacent row reports yen amounts. Long and short totals each combine the exchange’s “Negotiable” and “Standardized” margin categories. These are financing arrangements. “Standardized” does not identify an institutional investor. All three observations already reflect the three-for-one stock split effective October 1.
Standardized longs accounted for 2,157,600 shares of the increase, negotiable longs for 144,500. The November 13 ratio of 22.99 was the number of outstanding long shares divided by the number of outstanding short shares. By November 17 it was 27.77, helped by a smaller short balance as well as a larger long balance. Market-wide buy orders and sell orders are outside that calculation. The price trend also depended on the window. The close recovered to ¥8,025 on November 18 and ¥8,271 on November 19.
JPX, 11/13 report (application date) · JPX, 11/16 report (application date) · JPX, 11/17 report (application date) · Tokyo daily prices
A margin call has its own timetable
A business can keep generating cash long after a shareholder’s collateral deadline has passed. A call for additional collateral and a forced sale are separate events. The exchange-wide balance says nothing about either event in one brokerage account. The practical documents are the broker’s margin rules and the actual account notice. Look up when collateral is valued, the haircut applied to pledged shares, how to satisfy a shortfall and the deadline. Another position in the same account can change the answer even when Kioxia’s price is identical.
Example of a Japanese broker’s rules (Rakuten Securities, in Japanese)
What cash did the business actually generate?
Kioxia generated ¥2.380 trillion in operating cash flow from April through September 2026. Deduct all net investing cash outflows and the result is ¥2.187 trillion. Deduct only cash purchases of property, plant, equipment and intangible assets and the result is ¥2.243 trillion. Net investing cash flow includes other transactions. A reader comparing two free-cash-flow figures needs both the period and what each author deducted.
| Operating CF case | Operating CF | Gross PP&E and intangible purchases | Resulting FCF |
|---|---|---|---|
| −20% | 1.904 | 0.137 | 1.767 |
| Reported half-year | 2.380 | 0.137 | 2.243 |
| +20% | 2.855 | 0.137 | 2.719 |
← Swipe to view the full table →
The middle row uses reported figures. The outer rows change operating cash flow by 20% while holding gross asset purchases constant. Simply doubling the reported six-month results produces ¥4.373 trillion and ¥4.485 trillion under the two definitions. An annual ¥5 trillion figure would require another assumption. The September balance sheet showed about ¥0.975 trillion in income taxes payable. Tax timing, investment in manufacturing capacity and working capital can all change what is available for a buyback or for servicing debt.
Kioxia’s interim consolidated financial results, October 30
What would ¥1,000 per share buy?
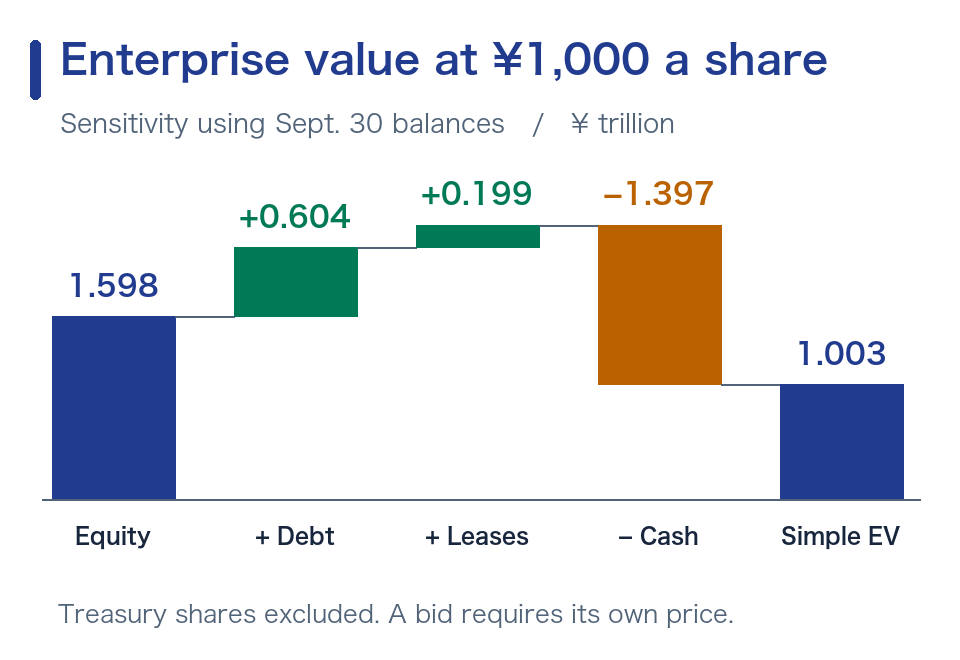
After excluding treasury shares, Kioxia had 1,597,905,534 shares outstanding on September 30. Set the price at a hypothetical ¥1,000 and the equity is worth ¥1.598 trillion. Add ¥0.604 trillion of bonds and borrowings and ¥0.199 trillion of lease liabilities, then deduct ¥1.397 trillion of cash and cash equivalents. The simplified enterprise value comes to a positive ¥1.003 trillion. Comparing equity with one period’s cash generation answers a different question from calculating enterprise value.
| Hypothetical price | Equity ex treasury | EV excluding leases | EV including leases |
|---|---|---|---|
| ¥1,000 | 1.598 | 0.804 | 1.003 |
| ¥2,000 | 3.196 | 2.402 | 2.601 |
| ¥3,000 | 4.794 | 4.000 | 4.199 |
← Swipe to view the full table →
The calculation keeps the September share count, cash and financing balances fixed while changing just the share price. It does not predict where the stock will trade or what the balance sheet will look like then. An acquirer would have to persuade shareholders to tender, fund the transaction and keep the factories running. A valuation based on the last trade says little about the price at which all those shareholders would sell.
What would make a buyback or takeover real?
Start with a dated announcement. On October 30, Kioxia described the approximately ¥800 billion buyback it had executed in August. Management also said it was holding off on additional repurchases while considering investments and taxes. The capital-return policy referred to surplus funds after spending commitments. An earlier purchase and a future budget are two different inputs to an investment case.
A hypothetical ¥2.5 trillion budget divided by ¥3,000 per share produces about 833 million shares. That arithmetic assumes the price stays fixed and enough sellers come forward. An index provider’s free-float factor gives no count of offers available at a given price. Completing a purchase and subsequently cancelling treasury shares are also separate corporate actions.
Kioxia’s capital-return policy · Management’s October 30 Q&A · JPX free-float adjustment
A management buyout raises the practical question of who negotiates on behalf of outside shareholders. A cloud provider considering a bid would have to compare the cost of owning and funding manufacturing with securing supply under a long-term contract. The proposed ownership, voting rights and businesses involved would matter to any assessment of foreign investment or competition issues. A lender would also want to know whether debt could still be serviced through a memory-price downturn. Without a specific bid and financing terms, the stock price that would trigger such a transaction remains unknown.
METI’s fair M&A materials (Japanese) · Ministry of Finance’s inward investment screening materials (Japanese)
Three questions for the next sell-off
Which positions remained open on the trade date? How much cash did the company generate after investment? How long can the holder meet the broker’s collateral requirements? Each question points to a different document. In Kioxia’s case the first one explains how open longs could rise during a slide. The other two help explain why even a cash-generating company can have shareholders who cannot wait for the price to recover.






Comments