
A claim of more than twice the bandwidth can sound like twice the memory capacity—or twice the AI performance. Those are different quantities. A memory stack can hold the same amount of data while moving it much faster.
HBM4 vs HBM3E starts with three different measurements
HBM stacks DRAM dies and provides many connections for high data throughput. Capacity, usually stated in GB, measures how much can be stored. Bandwidth, stated in GB/s or TB/s, measures data transferred per second. Latency measures the delay before a response. Increasing one does not automatically improve the others in the same proportion.
For how HBM stacks are integrated beside compute dies, see our CoWoS packaging and supply-constraint guide.
Micron’s HBM4 page gives a useful example: its 12-high, 36GB comparison retains the prior generation’s capacity while raising bandwidth. Stack height describes a count of stacked DRAM layers; capacity also depends on die density and the product configuration.
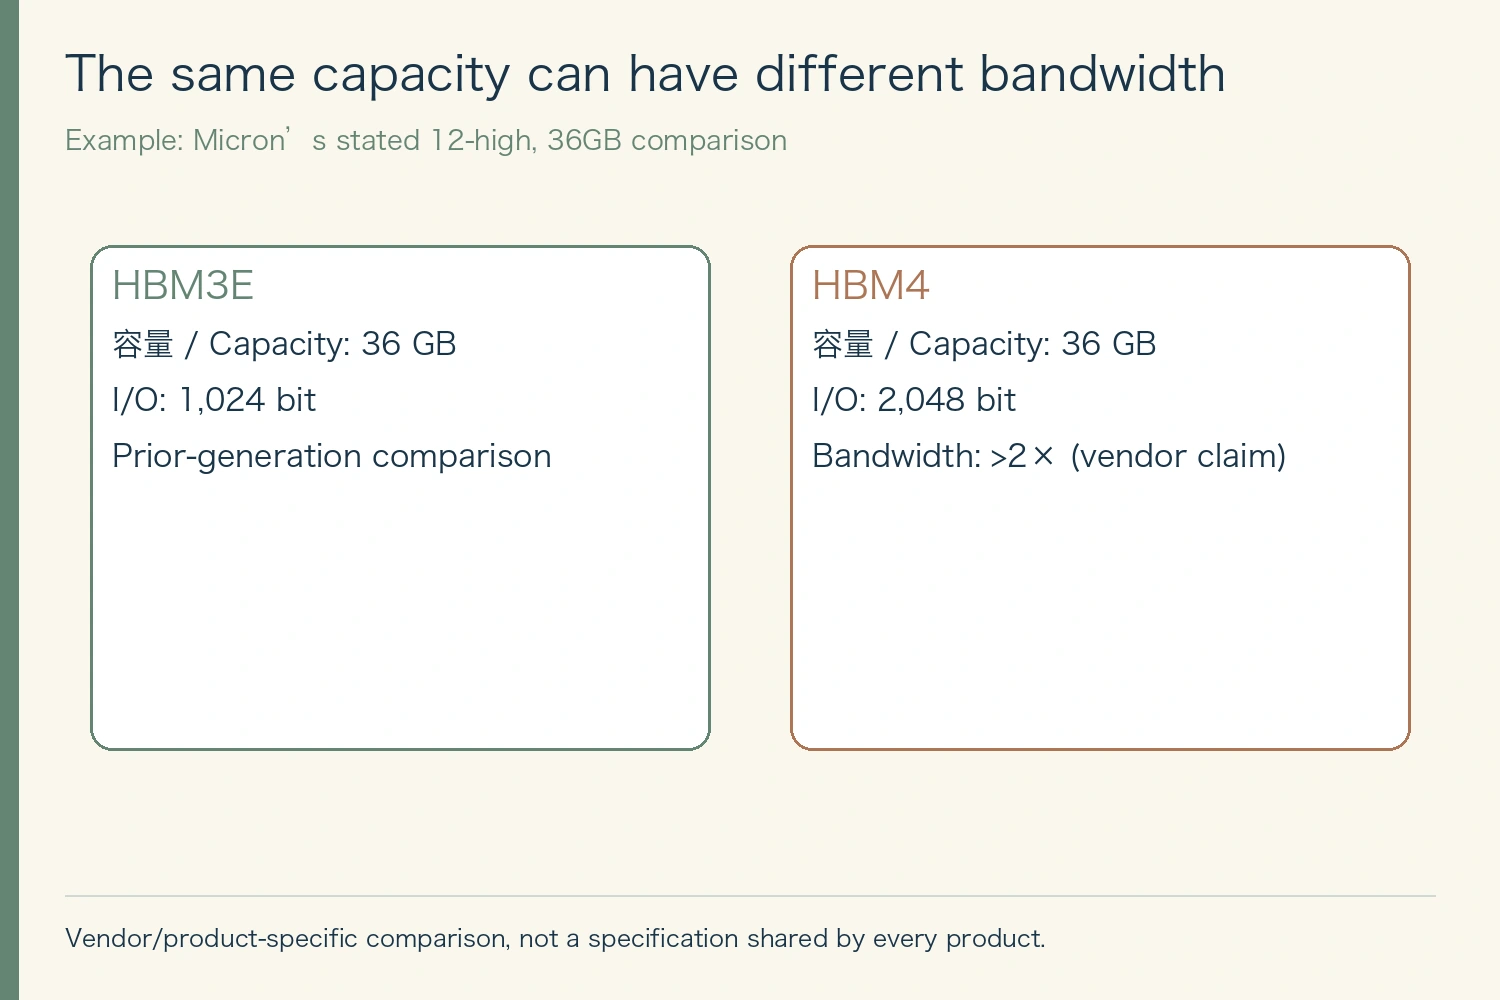
Think of capacity as storage space and bandwidth as the rate at which data can move. The analogy explains the distinction, not the performance of an entire computer. Compute, interconnects, software and access patterns can still limit the application.
A 2,048-bit interface is not 2,048GB of capacity
Interface width describes parallel data connections. To estimate theoretical peak transfer bandwidth, multiply the width by the data rate per pin and convert bits to bytes. The 2,048-bit and 1,024-bit widths discussed for HBM4 and HBM3E are not storage capacities.
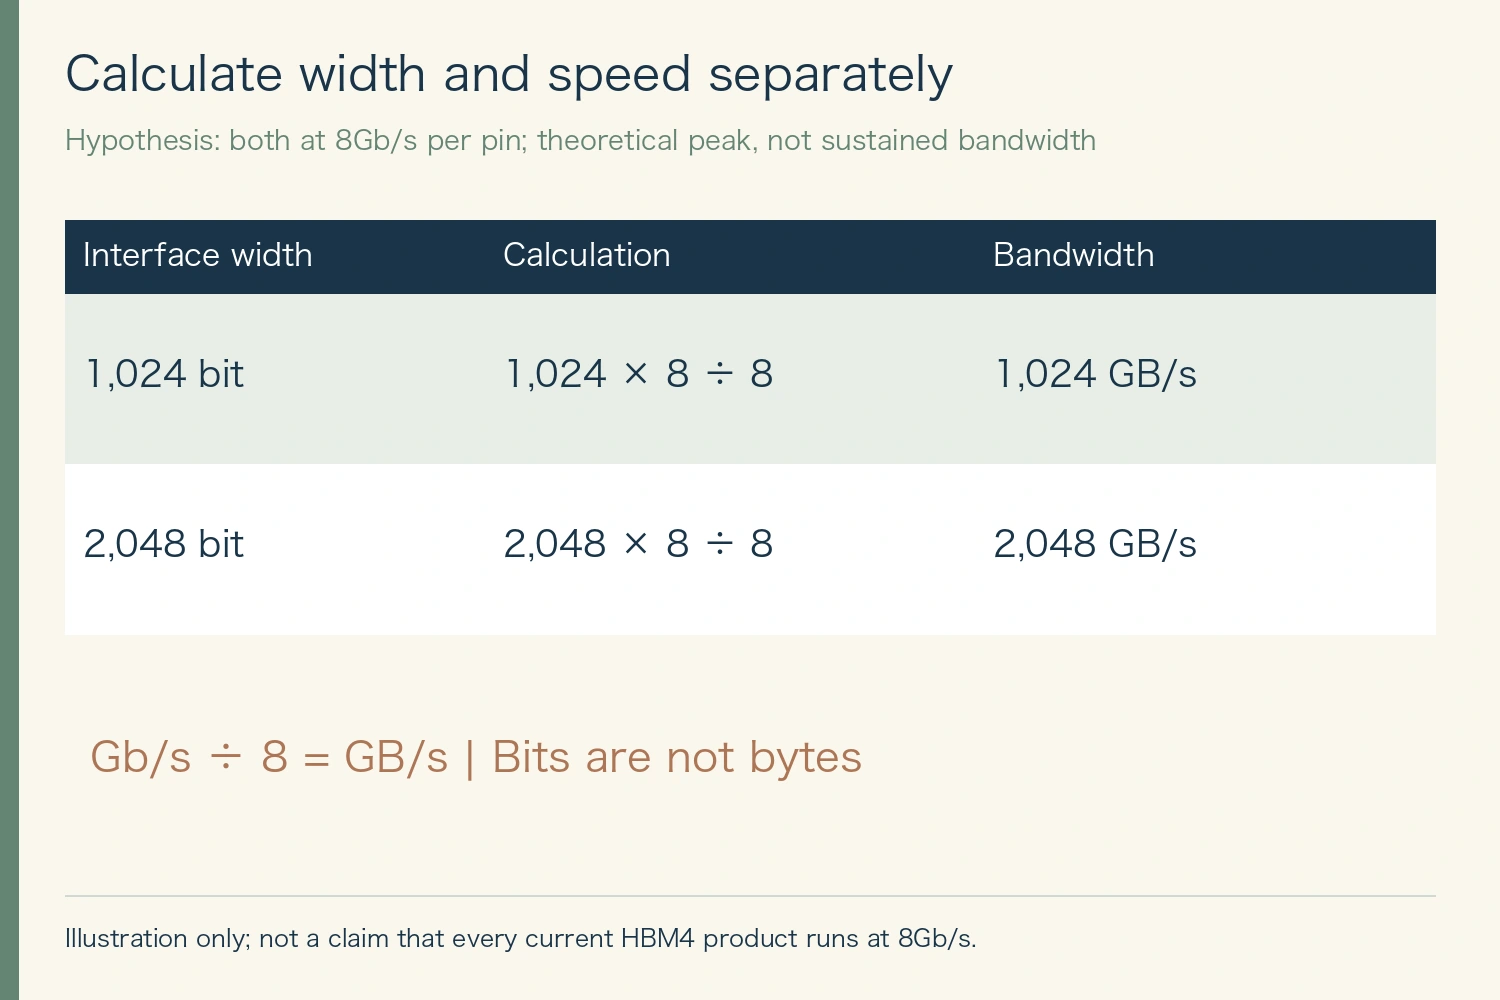
Our independent example fixes both pin rates at 8Gb/s. A 1,024-bit interface gives 1,024 × 8 / 8 = 1,024GB/s; a 2,048-bit interface gives 2,048GB/s. Holding the other input constant isolates the effect of width. It does not claim that every current HBM4 product operates at 8Gb/s.
The lowercase b in Gb means bits; uppercase B in GB means bytes. Eight bits make one byte. The example uses decimal GB/s, not GiB/s. It also calculates a peak, rather than sustained useful throughput. Scheduling, control overhead and the workload’s access behavior prevent a specification sheet from becoming an automatic application benchmark.
Advertisement
Separate a standard, a product specification and a production milestone
The date and development stage belong beside the number. Samsung’s February 2026 release discusses commercial HBM4 shipments and product performance. SK hynix’s September 2025 release describes development completion and preparations for mass production. Those differently dated statements cannot establish a same-date ranking of shipped volume.
← Swipe to view the full table →
| Measure | Meaning | Additional check |
|---|---|---|
| GB | Storage capacity | Stack height and die density |
| GB/s or TB/s | Data transferred per second | Pin rate, width, peak vs sustained |
| pJ/bit | Energy per transferred bit | Operating conditions and scope |
| Sampling or production | Development and supply milestone | Qualification, revenue and period |
A standard provides a common framework. Actual product speed, capacity, customer qualification and output require additional evidence. Comparing one supplier’s maximum condition with another supplier’s different operating point can create an impressive but meaningless ranking.
The same discipline applies to later generations such as HBM4E. Sampling, qualification, volume production and recognized revenue are separate milestones. A launch aimed at a particular year does not mean all shipments in that year have switched to the new generation. Preserve the source date and stated scope rather than treating a product roadmap as completed sales.
Better energy per bit does not always mean lower total power
When efficiency is measured in pJ/bit, the quantity is energy used per transferred bit. A vendor comparison can hold speed or another condition constant. It should not be silently relabeled as a whole-system wattage reduction.
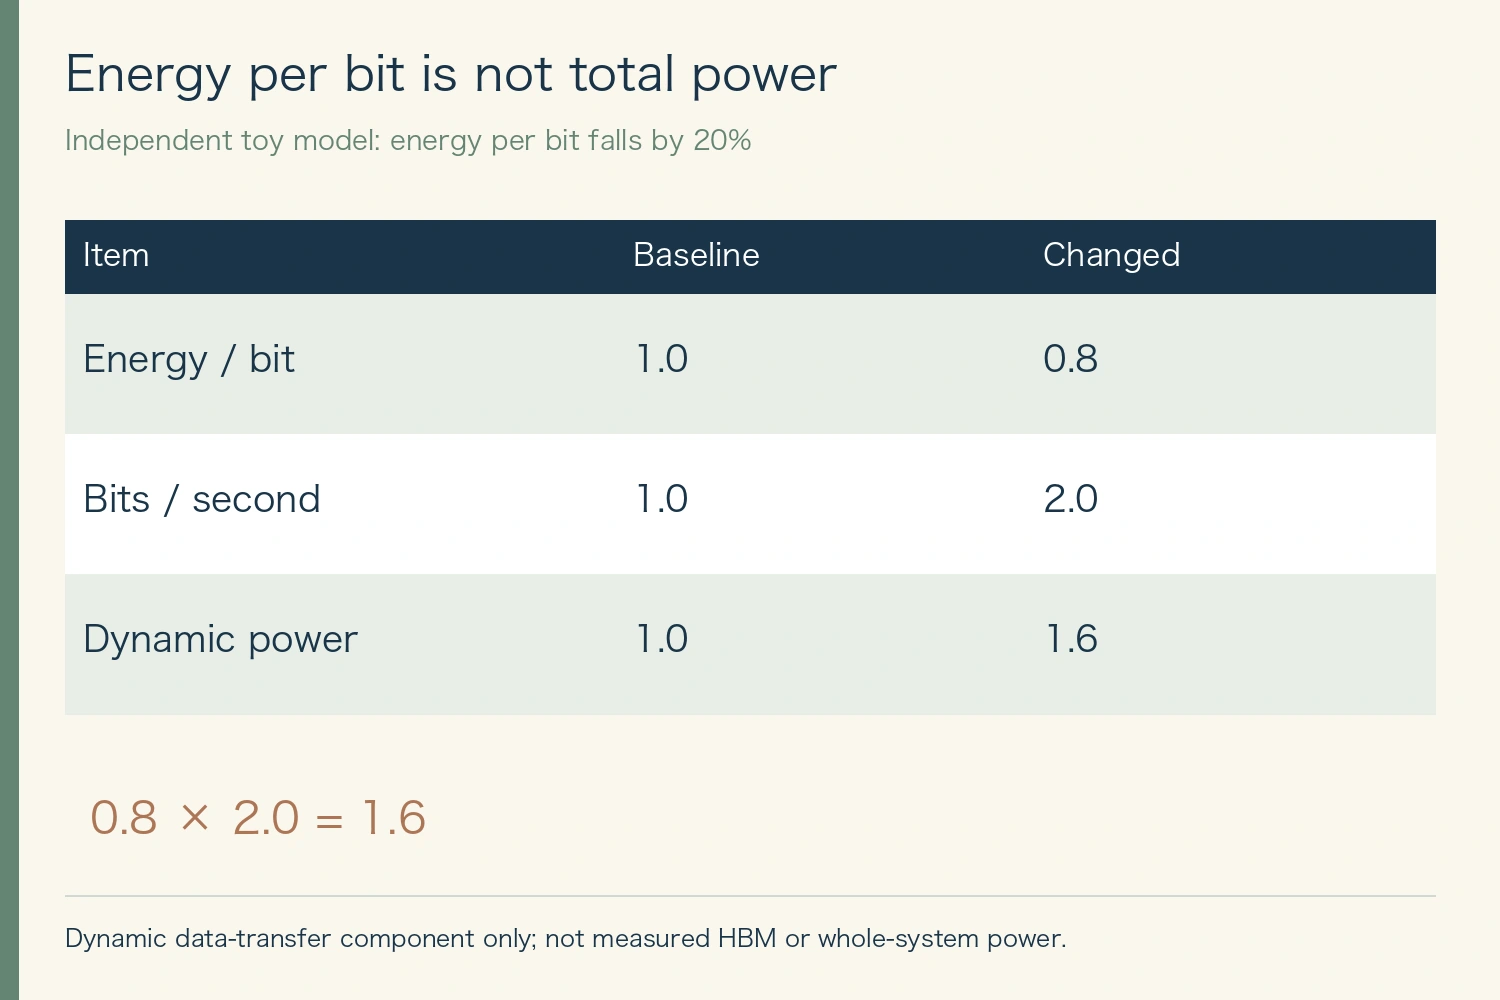
In our toy calculation, energy per bit falls from 1 to 0.8, while bits transferred per second rise from 1 to 2. The dynamic data-transfer power component becomes 0.8 × 2 = 1.6. Efficiency improves even though that component of power increases.
This is not measured HBM power or a server forecast. It omits standby and control power, compute, cooling and other loads. Its purpose is to identify the denominator. Ask whether an efficiency claim is per bit, per task, per chip or per system—and what was held constant. Those questions remain useful after today’s product generation changes.
Why a technical improvement is not an earnings forecast
A useful product does not, by itself, determine units sold, selling price or manufacturing cost. Additional process steps and equipment can change the economics of a faster memory design. Customer adoption and manufacturing ramp may also run on different schedules.
Company-wide revenue and inventory can include products other than HBM. A bandwidth increase cannot be applied as a multiplier to total company demand, earnings or valuation. Equity prices also reflect expectations, not simply the latest technical specification.
Keep a comparison record containing vendor, product, publication date, stack height, capacity, data rate, measurement conditions and production stage. Leaving an unavailable field unknown is more informative than filling it with a competitor’s number. A shorter table of genuinely comparable facts is preferable to a full table assembled from incompatible claims.
Advertisement
Common questions about HBM generations
Does HBM4 always have more capacity than HBM3E?
No. The cited 12-high comparison can hold capacity at 36GB. Check stack height, die density and the specific product rather than inferring capacity from the generation name.
Will an AI model run twice as fast with twice the bandwidth?
Not necessarily. A bandwidth-bound workload may benefit, but compute, communication, software and access behavior can prevent the application from matching the interface multiplier.
Can a larger SSD replace HBM?
Not simply because it holds more data. Storage and working memory occupy different roles. Memory hierarchies can move data between tiers, but capacity alone does not make the tiers interchangeable.
Related guides, sources and update policy
See our memory industry map for companies and product categories, and the KV-cache guide for inference memory requirements. This article focuses on interpreting generation comparisons.
For a research checklist, the author’s free Japanese-language note Three ways to read semiconductor news separates operating results, stock flows and product mechanics.
Sources checked November 6, 2026: official Micron, Samsung and SK hynix material. Vendor specifications are not independent performance tests. Interface and power examples are our own hypothetical calculations. The cover and three diagrams are original editorial graphics. Update product conditions and production milestones when new disclosures appear.
- SK hynix HBM product families
- SK hynix HBM4 development and production-readiness announcement (2025-09-12)
- Micron HBM4
- Samsung commercial HBM4 announcement (2026)
- TSMC CoWoS technology
This is general educational information. Evaluate an investment against your own objectives and the applicable product conditions.










Comments