

Buying TQQQ for the Nasdaq-100 and SOXL for semiconductors creates two positions. It does not necessarily create two independent sources of risk. The same chip companies can sit beneath both tickers, while different weights change which company matters most.
The useful question is not simply whether TQQQ or SOXL has performed better. It is what happens to your whole account when a company held through both funds moves. That question can be answered with a dated, transparent exposure calculation rather than a backtest optimized to a favorable start date.
Sources checked October 25, 2026. These are US-listed products. The worked calculations use September 30 index weights and ideal daily targets, not actual derivative positions or a recommended allocation.
TQQQ and SOXL track different indexes—but share companies
TQQQ targets three times the Nasdaq-100’s daily performance before fees and expenses. SOXL targets daily 3x exposure to the NYSE Semiconductor Index. Nasdaq-100 exposure is broader than chip companies, but it still contains chip companies.
For three constituents shown in both official factsheets, the Nasdaq and Direxion weights align at September 30, 2026. Using a shared date matters: combining one current weight with another fund’s older weight would produce a comparison that never existed at one instant.
| Company | Nasdaq-100 | NYSE Semiconductor Index |
|---|---|---|
| Nvidia | 8.36% | 7.40% |
| Micron | 5.04% | 7.95% |
| AMD | 4.19% | 9.29% |
| These three only | 17.59% | 24.64% |
The final row is only the sum of these three companies. It is not the total semiconductor weight, a full overlap score, or a statement that unlisted companies have zero weight. This limited scope makes the arithmetic checkable without pretending to reconstruct either entire portfolio.
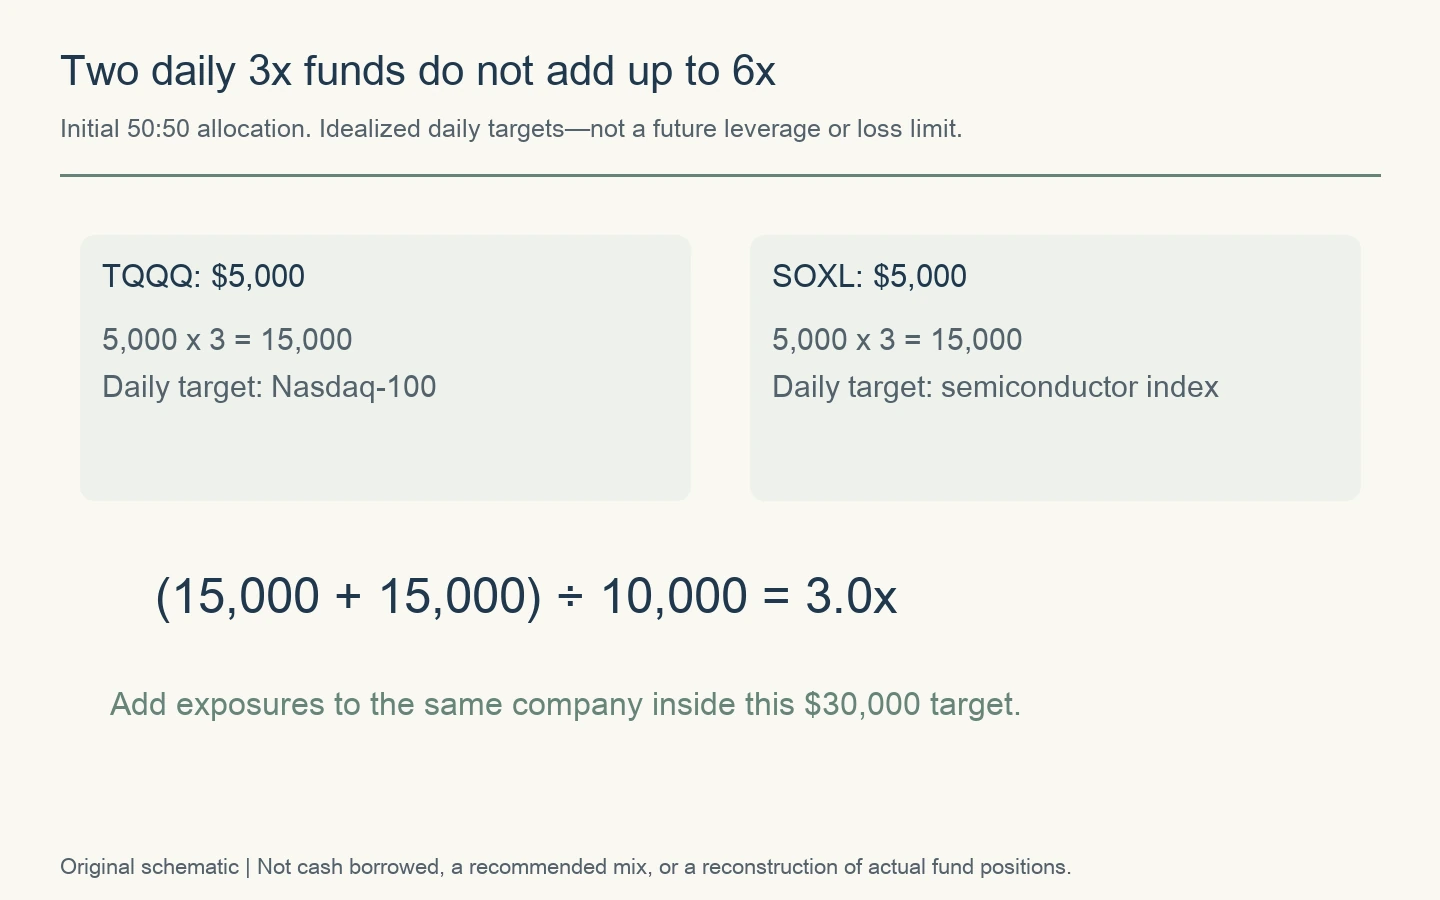
A 50:50 TQQQ/SOXL portfolio targets 3x, not 6x
Start with $10,000 of account equity and place $5,000 in each fund. Under exact daily targets, each position represents $15,000 of benchmark exposure. The combined $30,000 divided by $10,000 of equity is 3x. Multipliers must be weighted by the capital allocated to them; they cannot simply be added.
Portfolio weights can drift after different returns. Moreover, daily leverage is not a promise to deliver three times an index’s cumulative return over months. Fund-level resetting and account-level rebalancing are different operations. Changing the split does not remove the need to understand either one.
Calculate company exposure through the indexes
For company i, the approximation is: dollars allocated to TQQQ × 3 × its Nasdaq-100 weight, plus dollars allocated to SOXL × 3 × its semiconductor-index weight. Use weights as decimals. This is an ideal one-day sensitivity before fees and tracking differences, not directly owned stock.
For Nvidia, an all-TQQQ account gives $10,000 × 3 × 8.36% = $2,508. An all-SOXL account gives $2,220. A half-and-half account gives $1,254 + $1,110 = $2,364. The combined account has less Nvidia exposure than the all-TQQQ account in this snapshot.
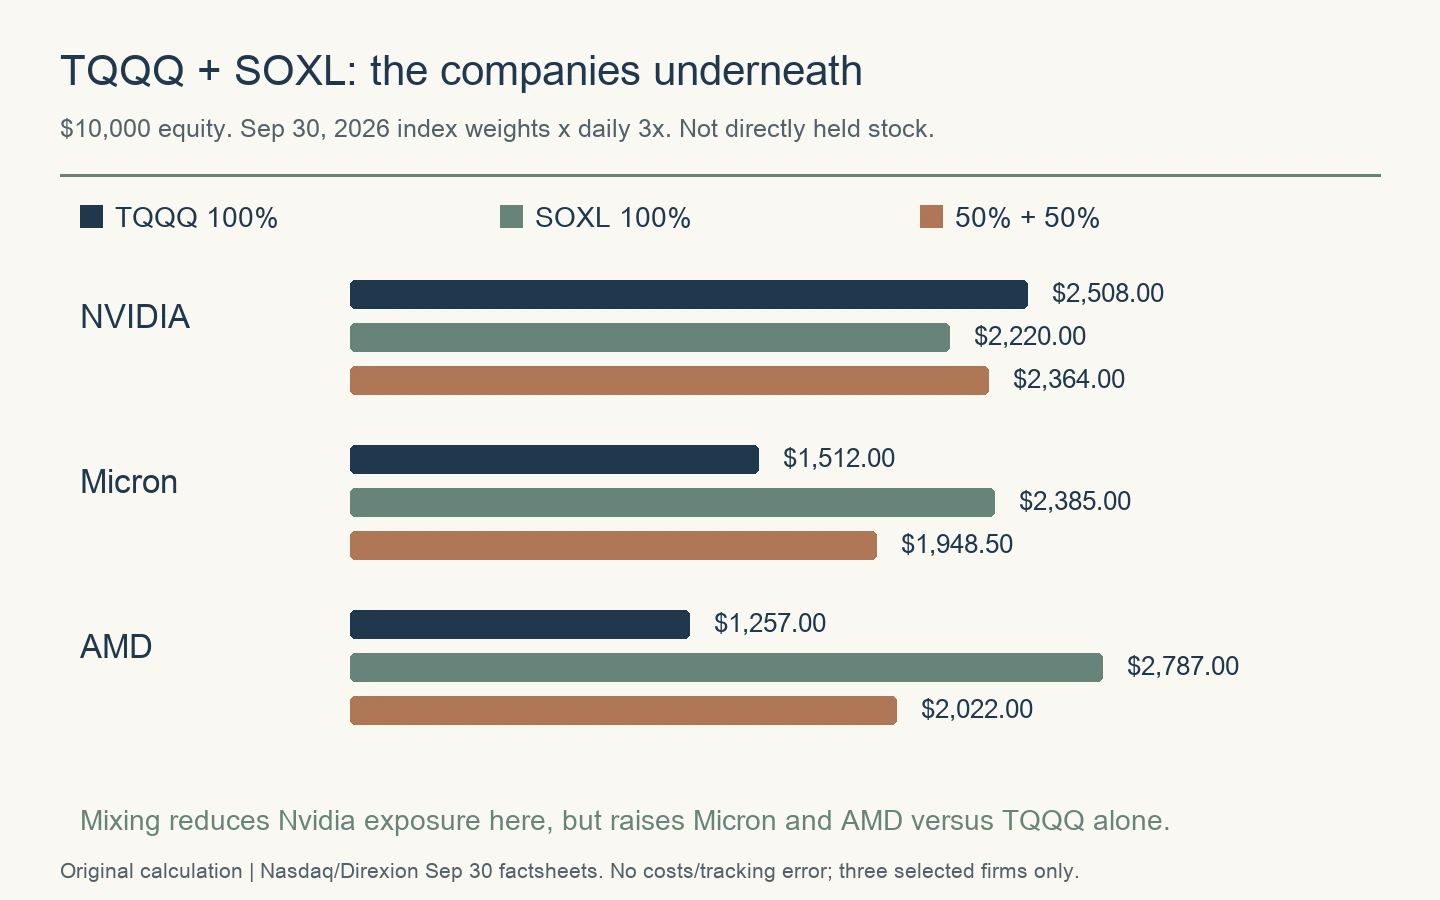
Micron moves the other way: $1,512 in all-TQQQ versus $1,948.50 in the mix. AMD rises from $1,257 to $2,022. Adding just these three gives $5,277 in all-TQQQ, $7,392 in all-SOXL and $6,334.50 in the mix.
Relative to an all-TQQQ position, the mix is therefore partly a shift away from Nvidia and toward Micron and AMD. An investor concerned specifically about Nvidia may evaluate that differently from an investor trying to reduce sensitivity to the semiconductor business cycle.
The $6,334.50 figure is 63.345% of account equity expressed as target notional sensitivity. It does not mean the investor directly owns that much of the three stocks. Looking through index exposure is especially important with leveraged funds: physical stock rows, cash collateral and swap lines are not interchangeable measures.
Advertisement
Turn overlap into a one-day stress question
Suppose all three selected companies fall 10% in one day and every other constituent is unchanged. With exact daily leverage, the approximate account losses are 5.28% for all-TQQQ, 7.39% for all-SOXL and 6.33% for the equal mix. The mix calculation is $6,334.50 × 10% ÷ $10,000.
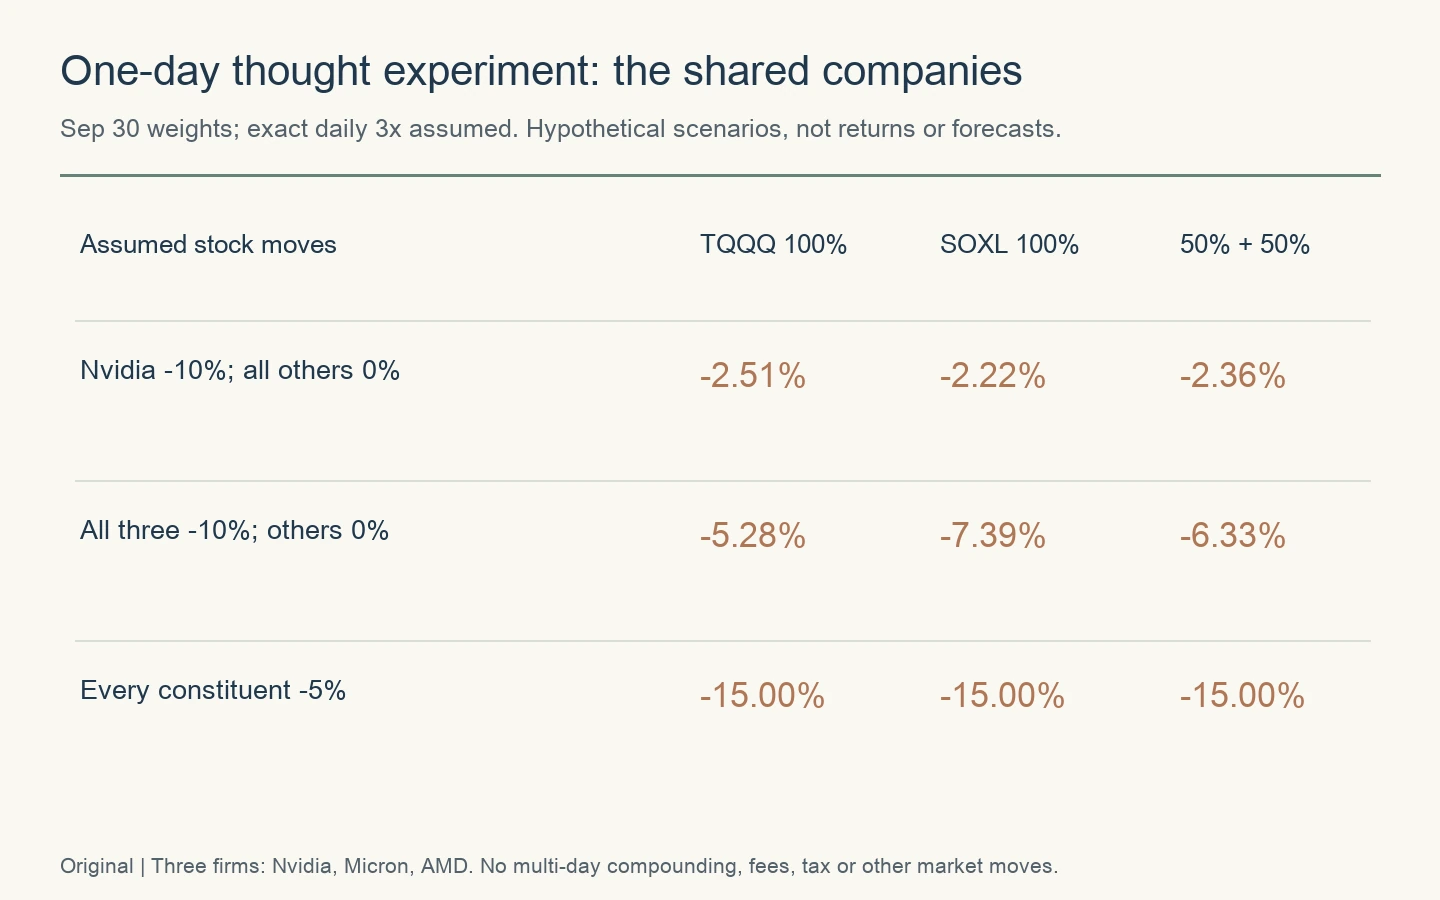
If every constituent instead falls 5%, both benchmark returns are -5%; all three accounts target -15% for that day. Two bullish leveraged positions have not created a hedge against that assumed market-wide move.
These are deliberately simple conditional calculations. Actual companies move together by changing amounts; costs, distributions, implementation and trading prices matter. A real multi-day stress test must reset the fund exposures, allow portfolio weights to change and state whether the investor rebalances. Do not extend this one-day table by multiplying it by a number of days.
Holdings overlap is not return correlation
Overlap describes shared constituents at a point in time. Correlation measures how returns co-moved over a specified sample. Companies with no shared listing can still respond to the same AI-capex news, interest rates or cyclical demand. Conversely, a common company does not force two indexes to move in identical proportions.
We have not calculated a full weighted overlap score or an empirical return correlation here. A correlation claim needs comparable return series, a common period, a declared frequency and consistent treatment of distributions. A screenshot of a holdings comparison is not that evidence.
Nor should a raw holdings tool be assumed to look through derivatives correctly. If its inputs count actual stock holdings but leave index swaps and collateral unexplained, its percentage may answer a different question from the company risk you intended to measure.
Check the rest of the account before choosing a ratio
First add direct holdings and other funds that expose you to the same companies. Then define the account: emergency cash that you cannot actually deploy should not be used to make the trading allocation appear less aggressive. Finally, decide how you will respond when weights change, before the stressful day arrives.
| Check | Action |
|---|---|
| Company concentration | Add relevant exposure from other funds and directly held stocks. |
| Shared drivers | List AI demand, chip pricing, financing conditions and other common adverse news. |
| Account boundary | Separate deployable capital from essential spending reserves. |
| Allocation maintenance | Record the starting mix, review dates and rebalancing rule. |
For the underlying mechanics, see TQQQ and daily compounding, SOXL’s semiconductor exposure and our position-size and hedge-cost checklist. Those decisions matter more than the apparent comfort of having two ticker symbols.
Sources, calculation boundaries and updates
The two official factsheets above supply the September 30, 2026 weights; issuer product pages supply the daily objectives. Sources were checked October 25. Only three named companies are aggregated. No full-portfolio correlation, complete overlap ratio or historical drawdown is claimed.
All worked sensitivities assume exact daily objectives and exclude fees, tracking differences, tax, FX and multi-day compounding. Updated comparisons should align dates again rather than refresh only one side. The arithmetic is reusable; the weights are dated observations, not permanent properties of either fund.




Comments