

A chart showing “Japan versus America” can conceal several different comparisons: the Nikkei 225 against the S&P 500, an unhedged Japanese-stock ETF against a U.S. fund, or local-currency price indexes against dollar total returns.
Those are not small technical differences. Currency and benchmark selection can change the apparent winner. Before asking which market will perform better, make sure the two lines answer the same question.
Nikkei 225, S&P 500 and Nasdaq-100: three different selection rules
The Nikkei 225 is a price-weighted index of 225 stocks on the Tokyo Stock Exchange's Prime Market. It is not a free-float market-cap-weighted measure of every Japanese listed company.
The S&P 500 covers large U.S. companies and uses float-adjusted market-capitalization weighting. The Nasdaq-100 selects large eligible Nasdaq-listed non-financial companies and uses modified market-cap weighting. It is not simply a technology-sector index.
| Benchmark | Main universe | Weighting approach | What not to assume |
|---|---|---|---|
| Nikkei 225 | 225 Tokyo Prime stocks | Price weighted, with index adjustments | A complete Japanese-market portfolio |
| S&P 500 | Large U.S. companies | Float-adjusted market cap | Equal money in every constituent |
| Nasdaq-100 | Large eligible Nasdaq non-financials | Modified market cap | Every American technology company |
An index's construction affects sector exposure and concentration. Comparing its return therefore compares both the country and the basket's design. A strong result does not identify which component caused it.
EWJ is Japanese equity exposure, not the Nikkei 225
The iShares MSCI Japan ETF, EWJ, states MSCI Japan Index (Net) as its benchmark. Labelling an EWJ backtest “Nikkei 225 returns” would be inaccurate. It may be a useful Japanese-equity proxy, but the proxy must be named.
For a dated example, iShares reports EWJ NAV total returns in dollars of 9.37% annualized over five years and 9.10% over ten years, ending September 30, 2026. These are fund returns with reinvested distributions and deducted expenses, not the Nikkei's yen price return and not forecasts.
Use a fund benchmark that matches the question. If you specifically want Nikkei 225 exposure, identify an instrument tracking that index. If you want broad Japanese equities, an MSCI Japan or TOPIX approach asks a different question.
How the yen changes a U.S. investor's return
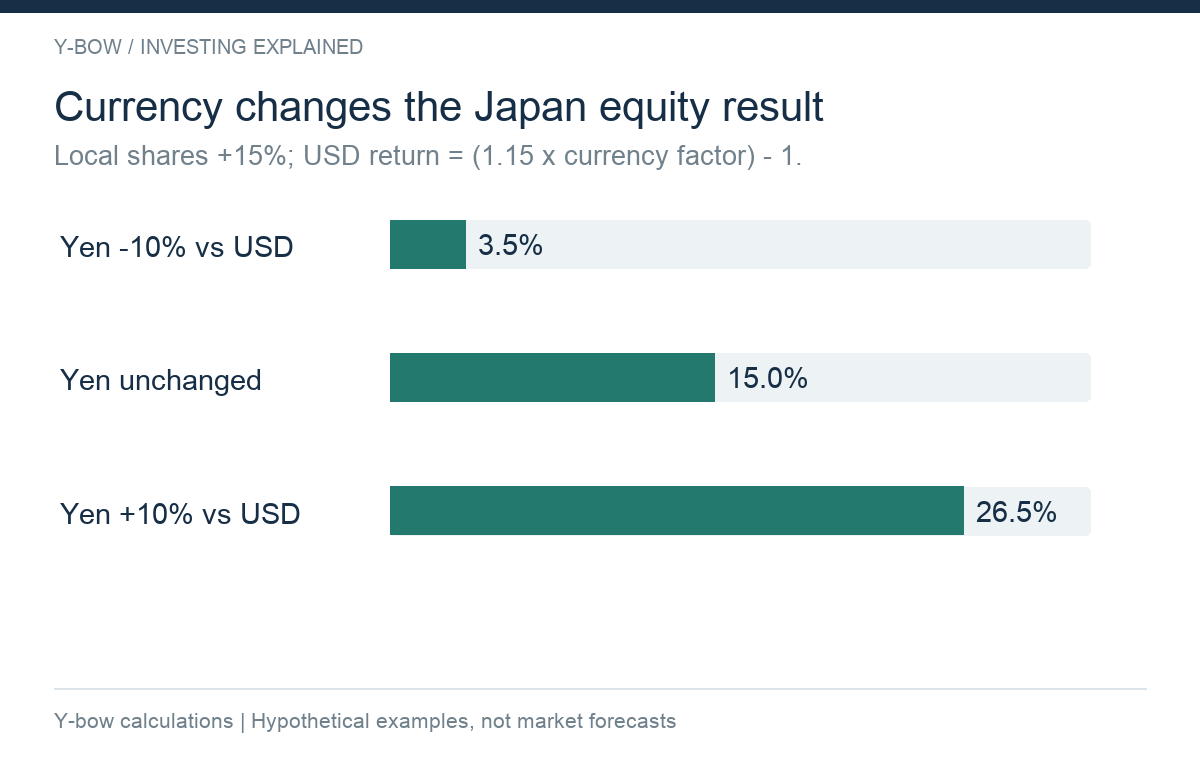
Let the local-currency equity return be r and the change in the dollar value of one yen be c. For a simplified unhedged investment, the dollar return is (1 + r) × (1 + c) − 1. Costs and tax are omitted.
Suppose Japanese shares gain 15%. If the yen loses 10% of its dollar value, the combined dollar return is 3.5%. If the yen gains 10%, the same local equity return becomes 26.5%. A dollar investor can therefore experience a very different result from a Japanese price-index headline.
| Hypothetical local stock return | Yen's dollar-value change | Combined dollar return |
|---|---|---|
| +15% | −10% | +3.5% |
| +15% | 0% | +15.0% |
| +15% | +10% | +26.5% |
Be careful with exchange-rate quotations. A move from 100 to 110 yen per dollar does not mean the yen gained 10%. One yen's dollar value fell from $0.01 to about $0.00909, a decline of approximately 9.09%.
A currency-hedged Japan fund is a different investment
WisdomTree's DXJ is a Japan hedged-equity fund. Comparing it with EWJ does not isolate currency alone: the equity-selection rules also differ.
Hedging aims to alter currency exposure, but it does not remove the companies' operating exposure to exchange rates. An exporter can still experience changes in sales, costs and translated earnings. Hedging also has implementation effects; it is not a free way to obtain whichever currency result would have been better.
A useful comparison table keeps three columns separate: equity benchmark, hedge policy and investor reporting currency. The exchange where a fund trades and the currency of its quotation do not settle all three.
Dividends and dates can change a long-term comparison
A price index excludes dividends. A total-return index includes reinvestment under its stated convention. A net total-return index incorporates a specified withholding-tax treatment. None is automatically your personal after-tax return.
Choose a common starting and ending date. An index series may extend back decades before the ETF being discussed existed. A simulated index result is not an investable fund's realized performance over that entire period.
A history ending in 2022 should remain labelled as a history ending in 2022. It cannot establish that a market has stayed below an old high today. For the Nikkei, use the publisher's current records and historical series rather than repeating a statement written before subsequent records were set.
How to build a comparison worth using
Start with the decision: are you adding geographical diversification, reducing concentration, matching future yen spending or expressing a short-term currency view? A ranking table cannot answer all four.
Then compare matched total-return series in one currency, with the same cash flows. Show the drawdown as well as the ending value. If using ETFs, identify fund expenses and reinvestment assumptions. If using indexes, state that index returns are not fund returns.
Run a second comparison with a different starting date. If the ranking reverses, that is useful information about period sensitivity, not a reason to delete the less attractive chart. A rolling-period analysis can be more informative than one carefully chosen endpoint.
Why adding leverage does not settle Japan versus U.S. stocks
Daily 2x and 3x products introduce reset frequency, financing and path dependence. Comparing one leveraged Japanese fund with an unleveraged American ETF changes several variables at once. A lower result does not prove the country's market cannot reward investors.
Also check the legal wrapper. A mutual fund is not an ETF merely because a data tool accepts its ticker. Different dealing rules, share classes and expenses can matter. Do not call a proxy identical to another fund simply because both target the same daily multiplier.
For the leverage calculation itself, see investment leverage, margin and daily reset. Keep that decision separate from the geographical allocation decision.
A practical takeaway for international investors
There is no need to declare one country permanently investable and another permanently unsuitable. Identify the risk you are adding and measure it consistently. “MSCI Japan fund, unhedged, dollar total return, these dates” is a more useful description than “Japan underperformed.”
Sources checked October 15, 2026. Dated EWJ returns retain their September 30, 2026 measurement date. The currency table and figure are Y-bow hypothetical calculations, not a Japan-versus-U.S. performance forecast.










Comments