
“S&P 500 or Nasdaq-100?” sounds like a contest between two return charts. It is really a choice between two sets of portfolio rules. Once that is clear, the comparison becomes easier—and the limitations become harder to ignore.
Both indices can have large exposure to the same major companies. Buying a fund tracking each does not automatically give you two independent sources of risk. This guide explains what to compare before deciding how either fits your portfolio.
The selection rules come first
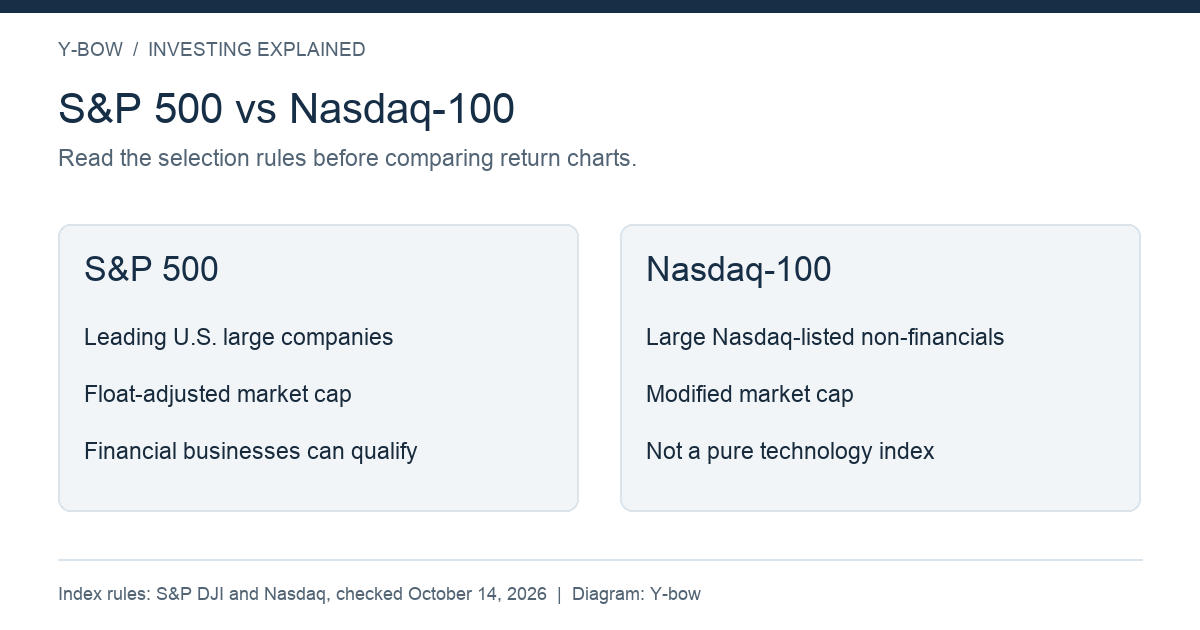
The S&P 500 represents leading U.S. large companies and uses float-adjusted market-cap weighting. The Nasdaq-100 selects large non-financial companies listed on Nasdaq and uses modified market-cap weighting. It is not simply a list of the world's 100 biggest technology businesses. These definitions come from the index providers: S&P 500 and Nasdaq's Nasdaq-100 guide.
| Feature | S&P 500 | Nasdaq-100 |
|---|---|---|
| Main selection frame | U.S. large companies | Large Nasdaq-listed non-financial companies |
| Financial businesses | Can be included | Excluded by index definition |
| Weighting | Float-adjusted market capitalization | Modified market capitalization |
| What to verify next | Current sector and company weights | Current sector and company weights |
Neither provider promises that its index will outperform the other. Membership and weights change; use the current factsheet when evaluating concentration.
Two funds can double the same exposure
Consider a hypothetical portfolio split equally between fund A and fund B. If one company has an 8% weight in A and 12% in B, its combined portfolio weight is 10%: 0.5 × 8% + 0.5 × 12%. Adding another ticker did not make the company disappear.
Repeat the calculation for major holdings and sectors. When a growth-oriented index rises sharply, its overlap with a broad index can matter more than the number of funds in the account. Holding both can be a deliberate overweight, but it should be recognized as one.
Compare total returns on equal terms
A fair historical comparison needs the same start date, end date, currency and treatment of dividends. Comparing a price index with a total-return index mixes different measures. Comparing a newly launched fund with another fund's longer history changes the market environment being tested.
Also separate the index from the fund. A fund's fees, tracking difference, trading spread and tax treatment affect what an investor actually receives. For someone spending in euros or pounds, an unhedged dollar asset also brings exchange-rate movements into the result. Listing an ETF in a local currency does not, by itself, remove the underlying currency exposure.
A larger decline changes the recovery requirement
Suppose two hypothetical portfolios start at 100. One falls 20% to 80; the other falls 40% to 60. They need gains of 25% and 66.67%, respectively, to get back to 100. This is the formula loss ÷ (1 − loss). It does not tell us which index will fall more in the next downturn.
The point is to compare the loss you can tolerate, not just the gain you would enjoy. If a decline would force you to sell to pay a near-term bill, extending a chart to a favorable recovery date does not solve the household problem.
Leverage changes the product, not just the expected return
A daily leveraged fund tied to either index has a different holding-period calculation from an unleveraged fund. You cannot multiply a ten-year index return by two or three and call it a fund forecast. The daily sequence, financing and expenses matter.
For an investor choosing a long-term core, begin with the unleveraged exposure and the financial goal. Only evaluate a leveraged implementation after understanding why the daily reset matters and how the position could affect the whole portfolio.
Questions to settle before buying
Write down whether you want broad U.S. equity exposure or a deliberate tilt toward the Nasdaq-100's selection rules. Calculate overlap with investments you already own. Decide what percentage loss would change your plan, and verify the actual fund's documents and availability in your jurisdiction.
You do not need to predict which index will win next year to make a coherent decision. You need a portfolio whose concentration, costs and downside you understand—and a contribution plan you can maintain.
Related articles
See our English article collection for ETF overlap and daily leverage. The Japanese companion discusses the original comparison.
Definitions checked October 14, 2026. Calculations and diagrams: Y-bow; hypothetical examples, not index performance data.
Continue with VT, VTI and VOO: When More ETFs Mean More Overlap and CAGR vs Average Returns: Why Gains and Losses Do Not Cancel.






Comments