
An inverse ETF looks like a simple answer to a difficult question: what should I buy if stocks are about to fall? The problem is that predicting the direction is only part of the trade. The path, the holding period and the size of the hedge matter too.
Start with the arithmetic before choosing a product. All numerical scenarios below are hypothetical, before costs, and are not historical returns. They help separate the mechanics of a hedge from the much harder task of predicting a market decline.
What an inverse ETF actually promises
An inverse ETF targets a negative multiple of its benchmark over a stated reset period, commonly one day. For example, Direxion's SPXS targets −300% of the S&P 500's daily performance before fees and expenses. That objective is not a promise to deliver minus three times the index's return over a month. Direxion: SPXL and SPXS.
Nor is an inverse ETF the same as borrowing shares and shorting them directly. The wrapper, financing, counterparty exposure and rebalancing rules differ. For a cash purchase of an ETF, the position can lose its invested value; using margin to buy it introduces additional account-level risks.
A two-day example: the market recovers, the hedge does not
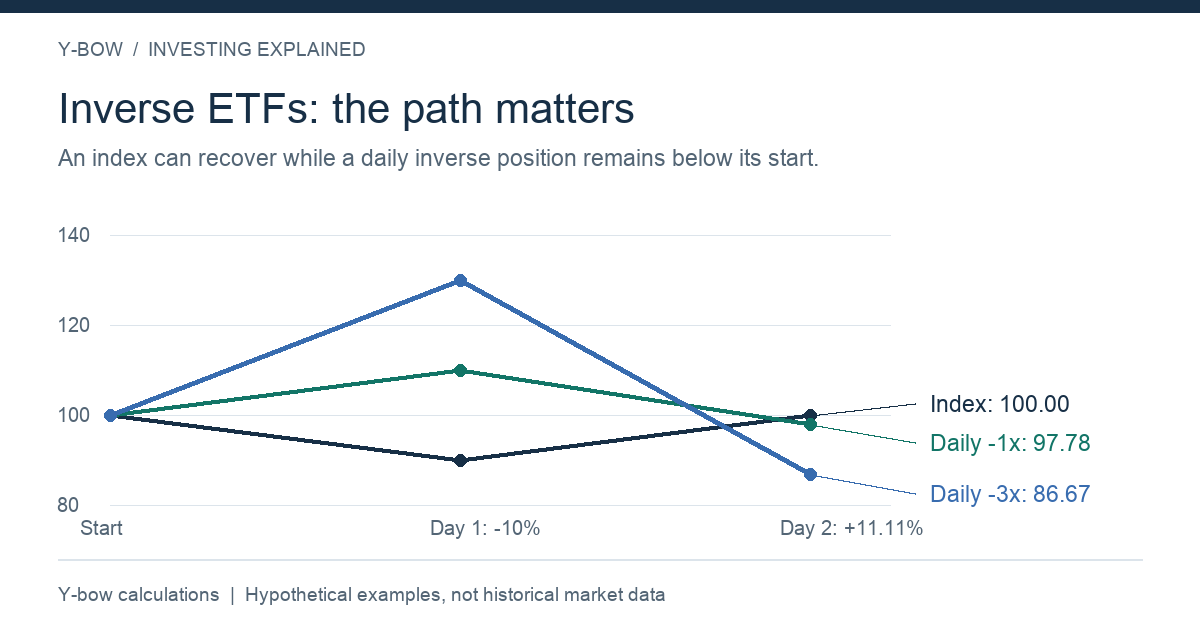
Suppose an index starts at 100, loses 10%, then gains 11.111%. It finishes back at 100. A hypothetical −1× daily fund goes from 100 to 110 to 97.78. A hypothetical −3× daily fund goes from 100 to 130 to 86.67. The direction reversed, and both inverse positions lost money across the two days.
| Starting value 100 | After day 1 | After day 2 | Total change |
|---|---|---|---|
| Index | 90.00 | 100.00 | 0.00% |
| Daily −1× | 110.00 | 97.78 | −2.22% |
| Daily −3× | 130.00 | 86.67 | −13.33% |
The calculation is simply successive multiplication: 100 × (1 − L × 0.10) × (1 + L × 0.111111), where L is negative for an inverse exposure. Real funds add costs, tracking differences and trading frictions. The SEC also highlights the danger of treating a daily objective as a longer-term objective. SEC investor bulletin.
Does daily rebalancing always cause a loss?
No. Consider two consecutive index declines of 5%. The index finishes at 90.25. A theoretical −1× fund finishes at 110.25, while a −3× fund finishes at 132.25. A persistent decline can help the inverse position compound. The important distinction is between a favorable trend and alternating moves, not a claim that every inverse fund must lose on every multi-day holding period.
This also explains why comparing two charts from different start dates can be misleading. A position entered just before a sustained fall is a different experiment from one bought after the first large decline. State the entry date, exit rule and benchmark before interpreting a backtest.
Sizing a hedge: dollars invested are not dollars exposed
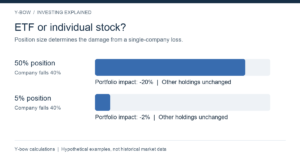
If a $10,000 stock portfolio is matched by a $1,000 position in a hypothetical −3× fund on the same index, the initial hedge is approximately $3,000 of negative exposure. It offsets roughly 30% of the stock exposure for a small first-day move, not 100%.
After a rally or fall, both values change. The hedge ratio must be recalculated. An ETF linked to a different index introduces basis risk: your stocks and the hedge may move differently when the trade matters most. A Nasdaq-heavy portfolio is not automatically hedged by an S&P 500 inverse fund.
A practical exit checklist
Before entering, write down the event you are hedging, the intended duration, the maximum position size, and what would end the hedge. Also compare the simpler alternative: holding less equity and more cash. Cash does not profit from a crash, but it does not need an accurate exit from a negative daily exposure either.
For a long-term investor, an indefinite inverse position can become an expensive second bet rather than protection. The useful question is not “will the market eventually fall?” It is “what specific risk am I reducing, over what period, and at what cost?”
Keep reading
Start with our English investing guides for portfolio risk and leveraged ETF explanations. The Japanese companion article covers the original discussion.
Product objectives checked on October 14, 2026. Illustrations and calculations: Y-bow. This is an educational explanation, not a recommendation to trade an inverse ETF.
Continue with TQQQ Explained: Daily Leverage, Compounding and Risk and Portfolio Backtesting: A Beautiful Chart Is Not a Forecast.







Comments