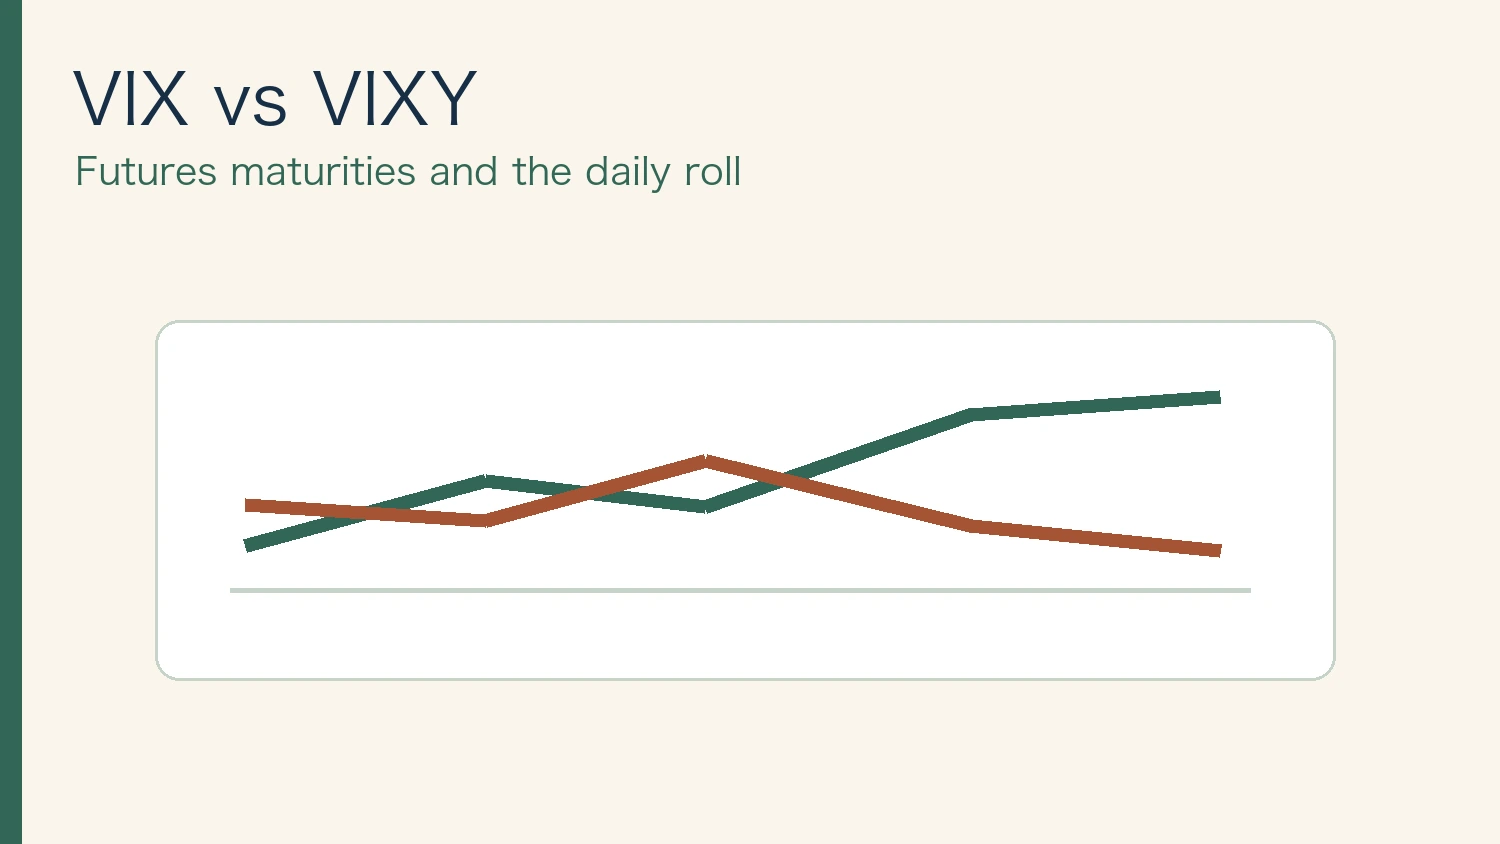
A jump in the VIX does not translate directly into the same percentage move in VIXY. The VIX Index is calculated from S&P 500 option prices and measures expected volatility over roughly 30 days. VIXY seeks to track an index that rolls VIX futures across expirations. The two instruments therefore respond to different points in time.
ProShares’ November 11, 2026 holdings disclosure illustrates the distinction by listing December VIX futures among the fund’s positions. The weights are a dated observation of a rolling portfolio. For a live comparison, use the latest holdings and match the date to the futures quotes.
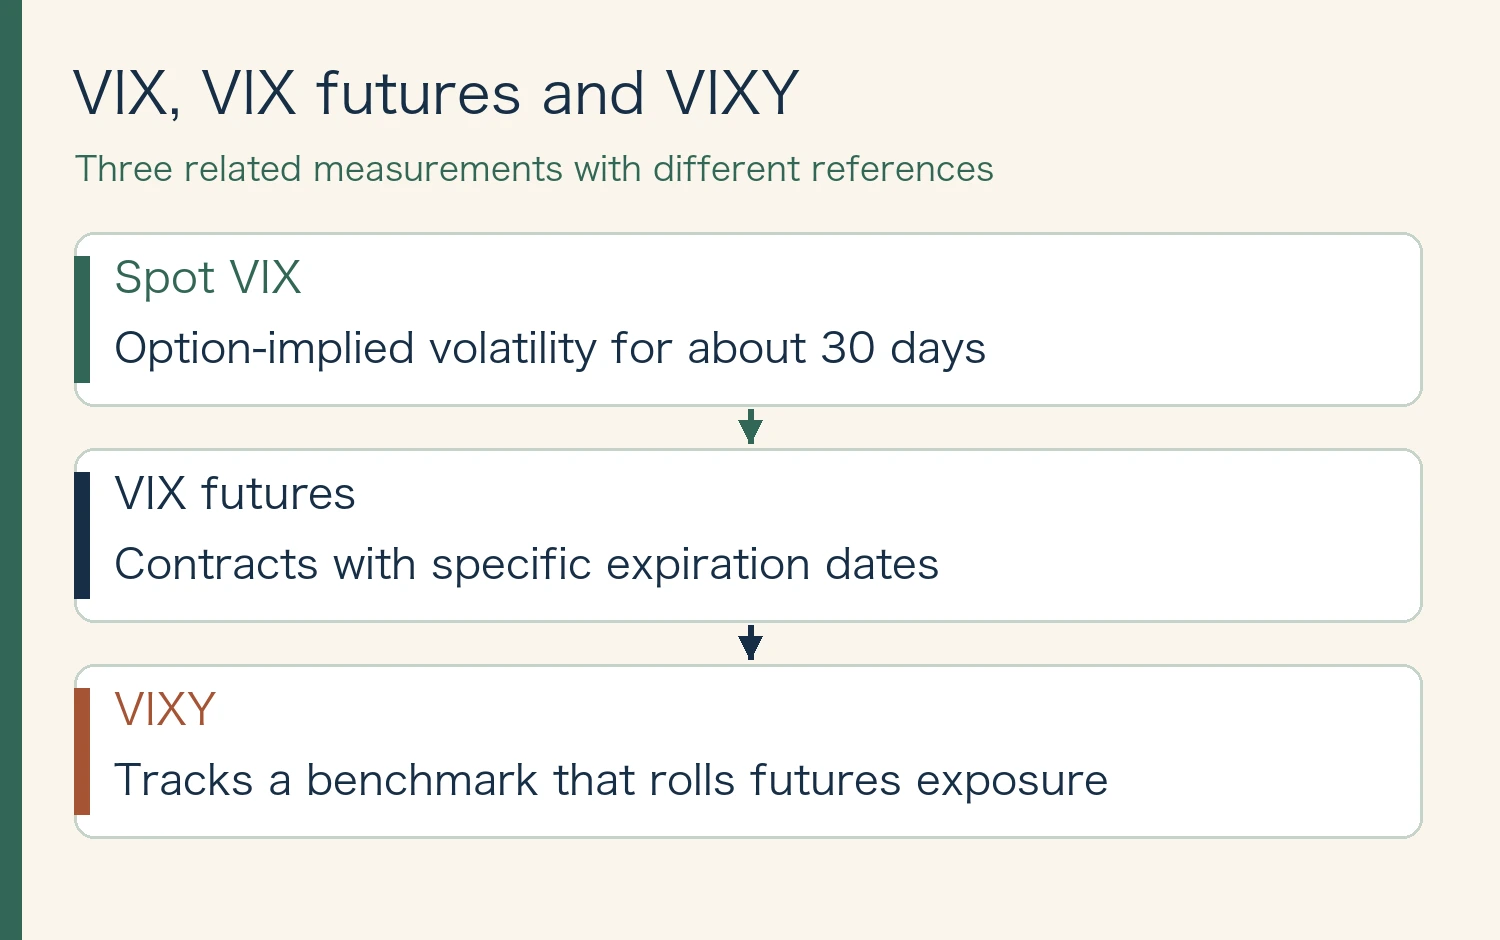
Follow the three layers
The spot VIX describes the magnitude of implied near-term S&P 500 volatility. It is not a direction forecast. A VIX futures contract reflects pricing for a specific expiration, when it will settle to the contract’s VIX-based settlement value. VIXY’s benchmark rolls exposure from the first-month contract into the second month to maintain an average maturity of about one month.
When spot volatility jumps, traders may expect some of the move to fade before a particular contract expires. Futures can therefore move less, or in some circumstances more, than spot VIX. The ETF also has its own NAV and a market price, which add separate observations.
Advertisement
Read the curve and the roll separately
In a simple two-expiry comparison, contango means the later contract trades higher than the nearer one. Backwardation means the later one trades lower. A snapshot describes the curve at that moment. It does not fix the path of either contract.
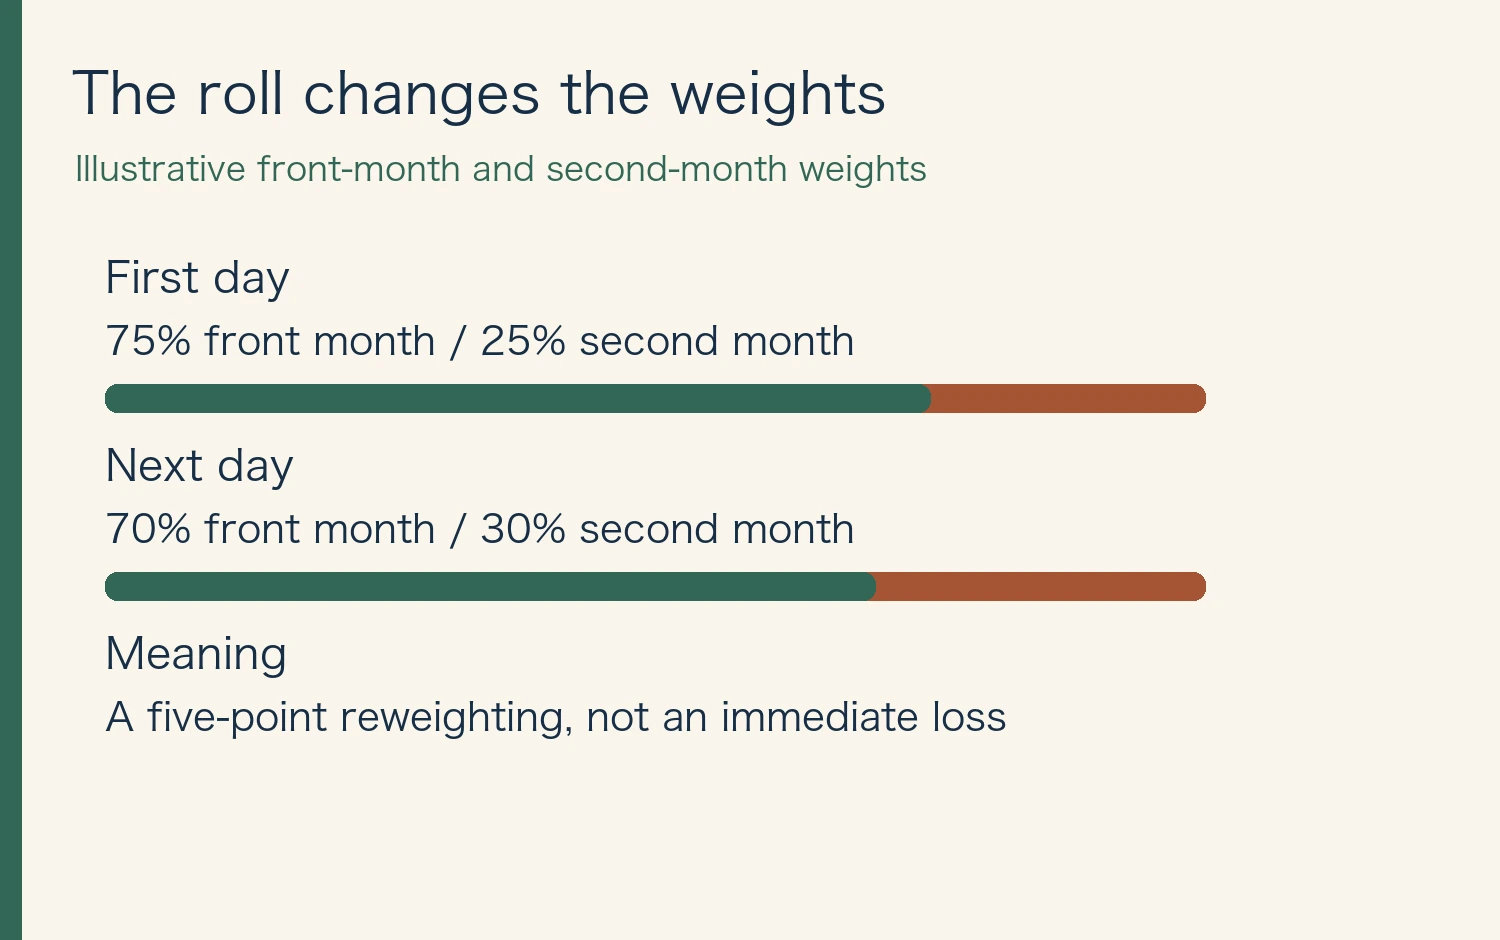
Imagine exposure shifting from 75% front month and 25% second month to 70% and 30%. The five-point shift is a change in weights. If the contracts trade at 18 and 20, the two-point difference is not an immediate cash loss deducted in full at the moment of rebalancing. The subsequent price behavior of the contracts, including convergence toward settlement, and fund costs affect realized performance.
Compare the same observation window
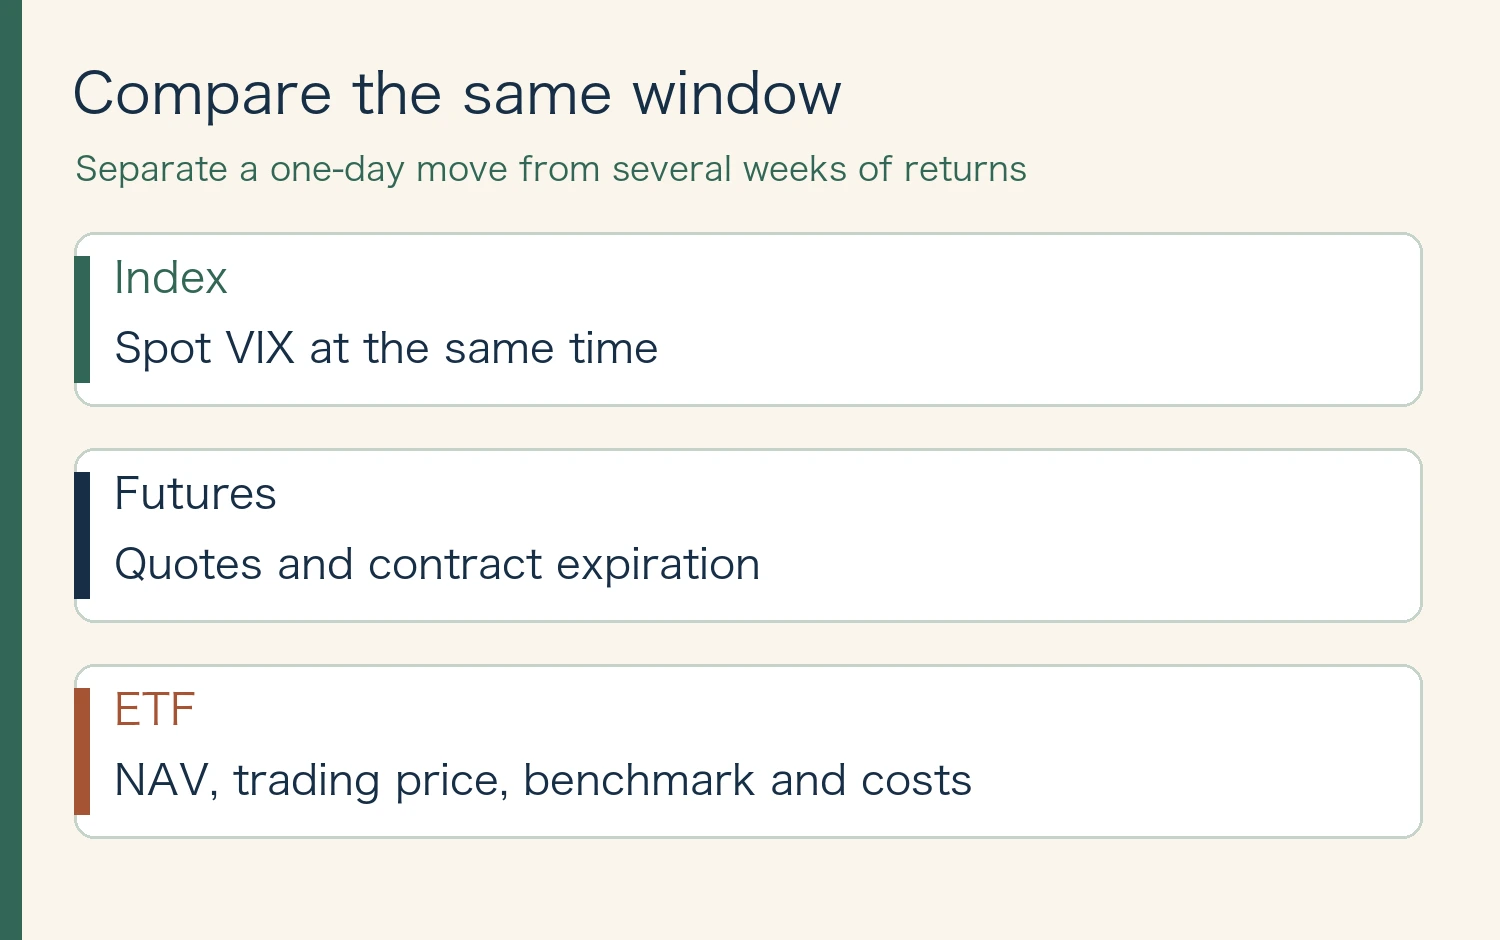
Record the VIX level, futures prices by expiration, the fund’s NAV return and its market-price return in separate rows. Use matching observation times where available, since closing conventions can differ. Compare single-session reactions separately from cumulative returns over days or weeks. Add the exact benchmark and expense information from the fund’s documents.
← Swipe to view the full table →
| Item | What to verify |
|---|---|
| Index | Spot VIX at the same time |
| Futures | Quotes and contract expiration |
| ETF | NAV, trading price, benchmark and costs |
Advertisement
A volatility position and an equity loss are different exposures
An equity drawdown can coincide with a rise in implied volatility, but the size, timing and futures response vary. Examine both the behavior during a shock and the carry during quieter intervals. A comparison of historical moves does not establish a reliable amount of protection for another portfolio.
Does contango guarantee a down day for VIXY?
No. Futures prices can rise, fall or change their relative shape within a session. The slope between expiries is only one part of the fund’s return.
Related reading: Compare an equity-ETF hedge with cash
Sources and review date
Sources reviewed November 12, 2026. Figures and the cover were created for this article. Dated disclosures and illustrative examples are labeled in the figures.
This article is for general education and does not recommend buying or selling a particular product.





Comments