

Revenue is up. Earnings beat the headline estimate. You feel relieved—then the stock falls. It is an uncomfortable moment: selling could mean missing a recovery, while holding could mean watching a manageable loss become a larger one. Reading the same “record quarter” headline again rarely resolves that tension.
A stock can fall after good earnings because “good” depends on the comparison. Better than last year is different from better than the company’s guidance, and both are different from better than expectations before the announcement. Investors may also reassess future margins, cash requirements or the valuation they are willing to pay.
This guide separates facts you can check in an earnings release from explanations that remain guesses. The aim is a repeatable review—not a formula for predicting the next opening price. It applies to earnings season generally, with particular attention to semiconductor investors who face large changes in demand, margins and capital spending.
Why stocks fall after good earnings: seven things to check
| Possible issue | What may have changed | Where to check |
|---|---|---|
| Expectations | Growth still missed the pre-release estimate | Timestamped consensus and comparable actuals |
| Forward guidance | Next-quarter growth or margins disappointed | Outlook and earnings-call discussion |
| Earnings quality | One-off items helped EPS | Footnotes and reconciliation |
| Cash requirements | Investment absorbed more cash | Cash-flow statement and capex |
| Valuation | The market pays a lower P/E | Comparable forward EPS and share price |
| Market and currency | Rates, peers or FX also moved | Consistent benchmarks and timestamps |
| Positioning | The pre-release rally or crowded exposure mattered | Volume and disclosures; label inference |
These are questions, not a ranking of proven causes. Several forces can operate at once. A large trading volume does not identify the seller’s motive, and an earnings release alone cannot prove that “institutions manipulated the price.” Leave uncertainty visible instead of replacing it with an appealing story.
1. An earnings beat needs a comparable benchmark
Imagine last year’s revenue was 100, company guidance was 115–125, analyst consensus was 128 and actual revenue was 125. These are invented index values, not a company forecast or historical market dataset.
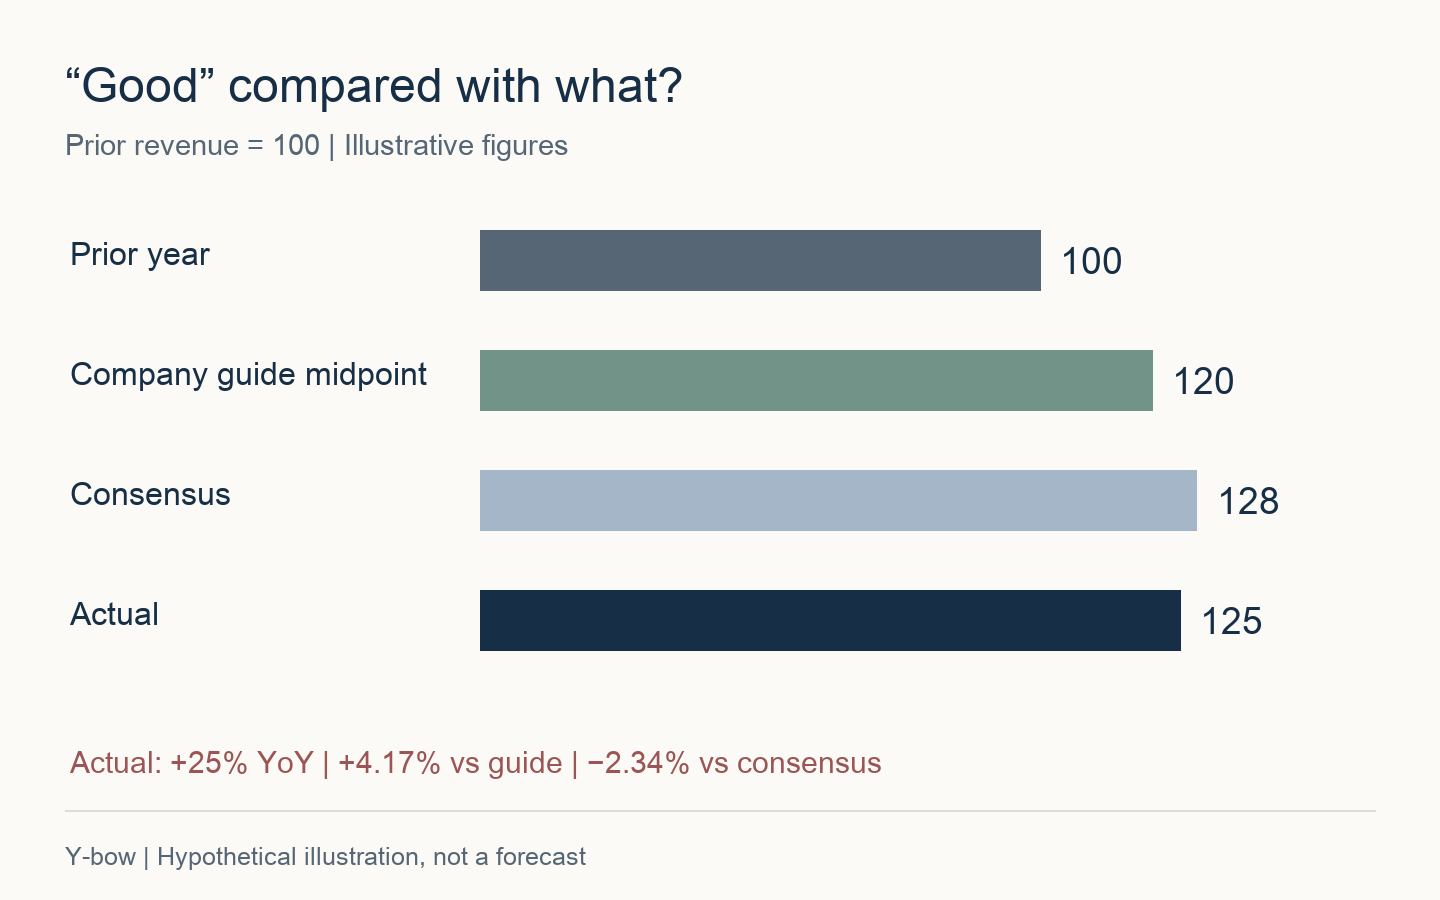
Revenue rose 25% year over year. It exceeded the guidance midpoint by 4.17%. It also missed consensus by 2.34%. All three statements are true. A headline that leaves out the benchmark leaves out much of the information you need. A company can outperform its own conservative range while still falling short of a more optimistic analyst estimate.
Save the estimate before the release
A consensus figure depends on the contributing analysts, the provider and the time it was captured. A revised estimate retrieved after results is not evidence of what investors expected before results. Save the value, period, accounting basis, source and timestamp together. If you do not have a reliable pre-release estimate, say so rather than reverse-engineering one from the share-price move.
Compare like with like: diluted EPS with diluted EPS, GAAP with GAAP, and adjusted EPS with an estimate using matching adjustments. The SEC’s non-GAAP guidance is a useful reference for examining adjustments and presentation. A beat obtained by comparing adjusted actual earnings against a GAAP estimate is not a meaningful surprise measure. Stock-based compensation, acquisition costs and other exclusions deserve attention even when a company regards them as non-core.
2. Forward guidance can matter more than the completed quarter
The reported quarter has already happened. Investors also need a view of the cash the business might generate from here. Strong actual earnings can sit beside a weaker next-quarter revenue range, a slower margin recovery or uncertainty about a major customer. Those changes can justify reassessment without making the completed quarter imaginary.
Read the revenue range, margin range, capex plan and underlying assumptions together. Keep the upper and lower bounds, not just the midpoint. “Guidance unchanged” can be reassuring in one setting and disappointing in another if investors had expected an increase. However, the assertion that guidance caused a particular stock drop requires more evidence than the existence of a cautious sentence in a press release.
A real example of comparing company guidance: TSMC Q3 2026
| Measure | Prior company guidance | Actual |
|---|---|---|
| US-dollar revenue | US$44.6–45.8bn | US$46.72bn |
| Gross margin | 65–67% | 66.4% |
The official TSMC Q3 2026 results page shows revenue about 2.01% above the top of the company’s range, while gross margin remained inside its range. Different parts of the same report deserve separate comparisons. This is a document-reading example, not an assertion that TSMC’s stock fell on these results; no share-price reaction is established here.
3. Higher EPS can be outweighed by P/E compression
P/E is price divided by earnings per share. Rearranging it gives price = EPS × P/E. Use the same annual earnings period and accounting basis on both sides of a comparison. Mixing trailing EPS before results with next-year adjusted EPS afterwards can create an apparent change that is partly a measurement problem.
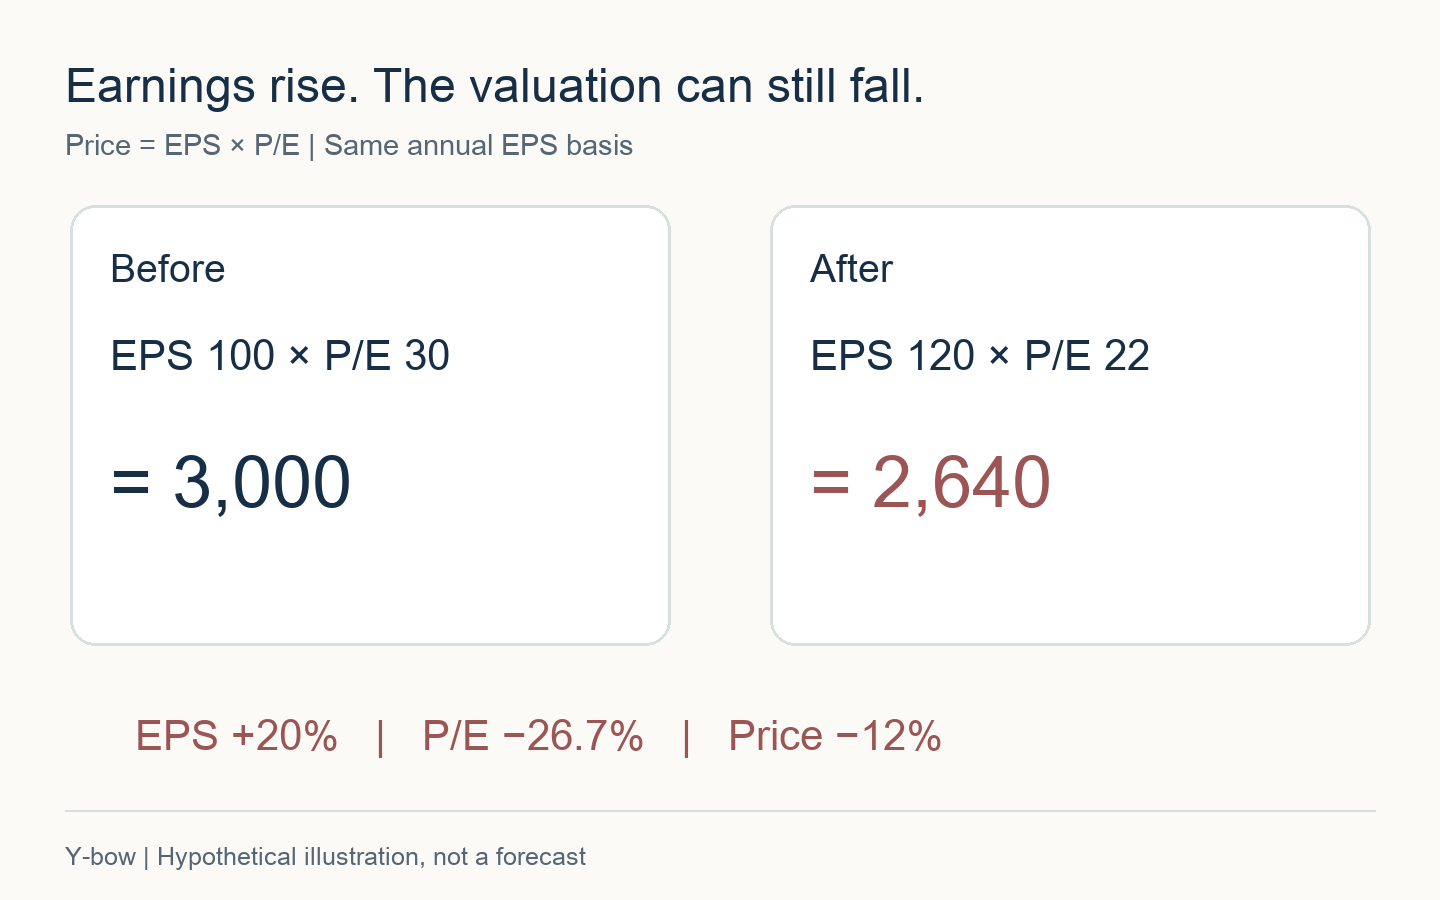
With EPS of 100 and a P/E of 30, the price is 3,000 in arbitrary currency units. With EPS of 120 and a P/E of 22, it is 2,640. Earnings improved 20%, but the price fell 12%. The relationship is multiplicative: 120/100 × 22/30 = 0.88. Adding the percentage changes would give the wrong result.
This identity does not tell you that 22 times earnings is fair, or that a multiple can be forecast independently with precision. It helps explain what would need to be true for earnings growth to translate into a higher price. Investors may demand a lower multiple if growth appears less durable, financing costs rise or uncertainty increases; none of those explanations is proven merely by observing a lower P/E.
For cyclical businesses, a low P/E can also coincide with unusually high earnings. If profits are near a peak, the denominator may not persist. At the other extreme, a loss-making period makes an ordinary positive P/E comparison unhelpful. For a sector-specific framework, see the memory industry map covering HBM, DRAM and NAND.
4. Check earnings quality and cash flow, not just EPS
A lower tax charge, a disposal gain or a change in the share count can alter EPS without a matching improvement in core operations. Compare revenue, operating profit and net profit, then look for the bridge between them. Read the notes before treating an unusual gain as recurring income. Also distinguish a company’s reported cash-flow figures from an adjusted metric it defines itself.
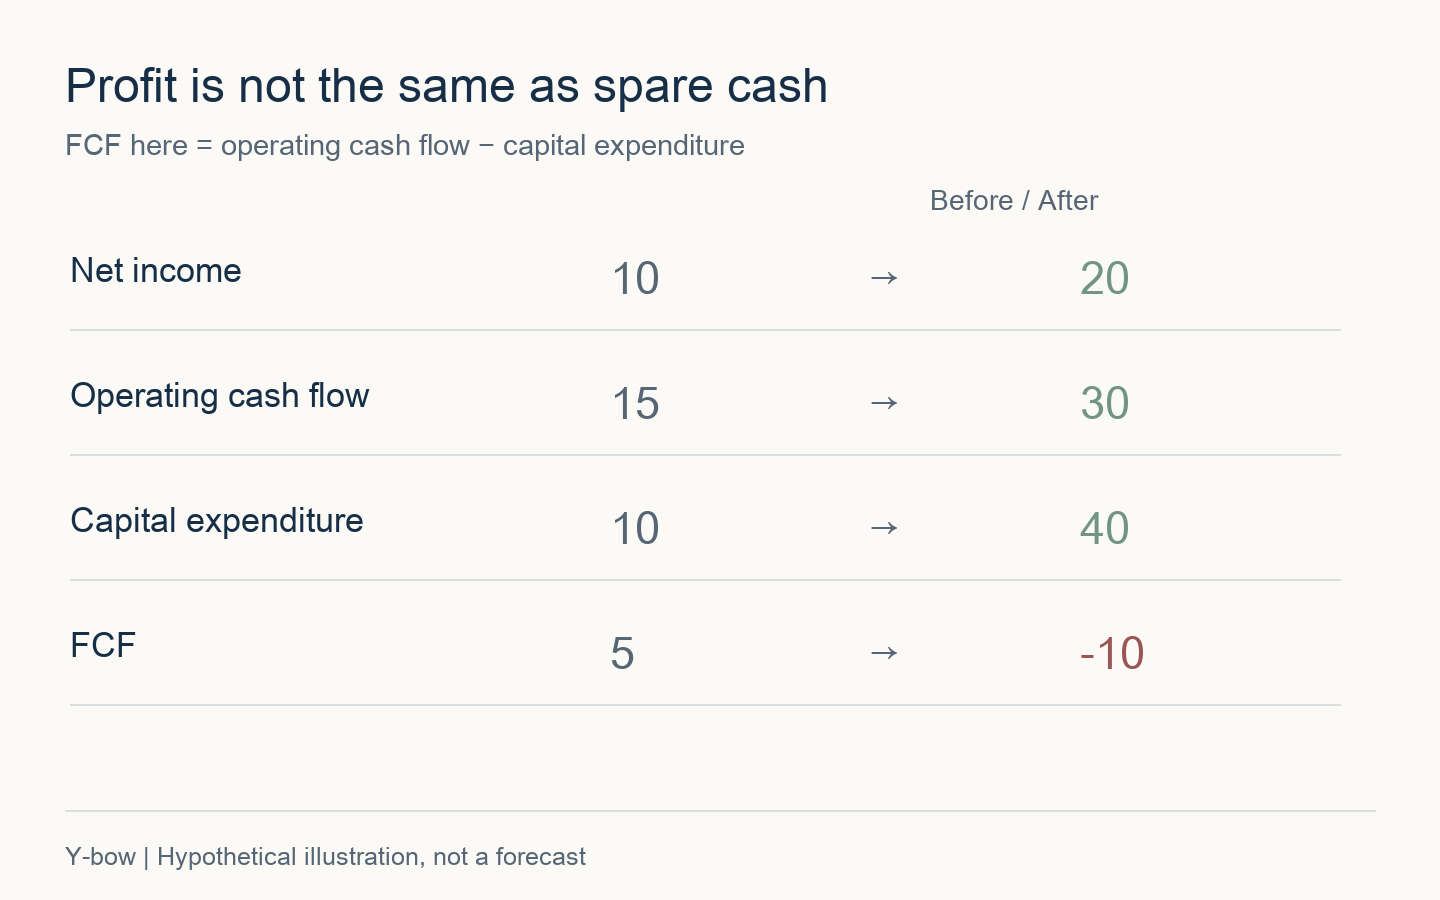
In the example, both profit and operating cash flow improve. Free cash flow, using the definition shown, becomes negative because capital spending increases faster. That is not automatically a bad investment: capacity built for future demand may earn attractive returns. The next questions are how long the cash will be committed, whether funding is adequate and what evidence supports the expected return.
For a semiconductor manufacturer, capacity spending, utilization, yield, product mix and depreciation all deserve a place beside revenue growth. Rising receivables or inventory may also warrant a closer look. They do not, on their own, prove improper accounting or collapsing demand. Ask why they changed and how the movement compares with the company’s business model and seasonality.
5. Measure the post-earnings move consistently
State the security, exchange, currency and measurement window. An after-hours low is not the same observation as the next regular-session close. A Taiwan-listed ordinary share and a US-listed ADR are not automatically synchronized observations. Avoid comparing quotes captured at different local times and calling the difference an earnings effect.
One usable convention is the last regular-session close before the announcement to the next regular-session close after the earnings call. Compare the relevant sector and broad market over the same interval. A stock down 4% on a day its sector fell 3% invites different questions from a stock down 4% in an unchanged sector. The one-percentage-point difference is still not a clean causal estimate: the company has other exposures and news may overlap.
For an international holding, the investor’s home-currency result can differ again. A local-currency return of −5% combined with a 3% appreciation of that currency against the investor’s home currency gives 0.95 × 1.03 − 1 = −2.15%, ignoring distributions, taxes and fees. Translate the exposure consistently before judging whether your portfolio did something different from the published stock chart.
6. “Priced in” is a starting question, not a complete explanation
A rally before results may indicate that some good news was already reflected in price. It does not make a subsequent fall inevitable. “Buy the rumor, sell the news” describes some episodes; it is not a reliable earnings-season rule. An excellent report can still lead to higher forecasts and a further rally, while a merely adequate report can disappoint optimistic positioning.
Look at the pre-release move, the valuation investors were paying, changes in the outlook and any newly disclosed uncertainty. Separate the observable record from your interpretation. If the evidence stops at “the stock rallied beforehand,” write that. Do not turn it into a claim about the intentions of every shareholder or a promise that a recovery must follow.
7. Before you sell or average down: a seven-point checklist
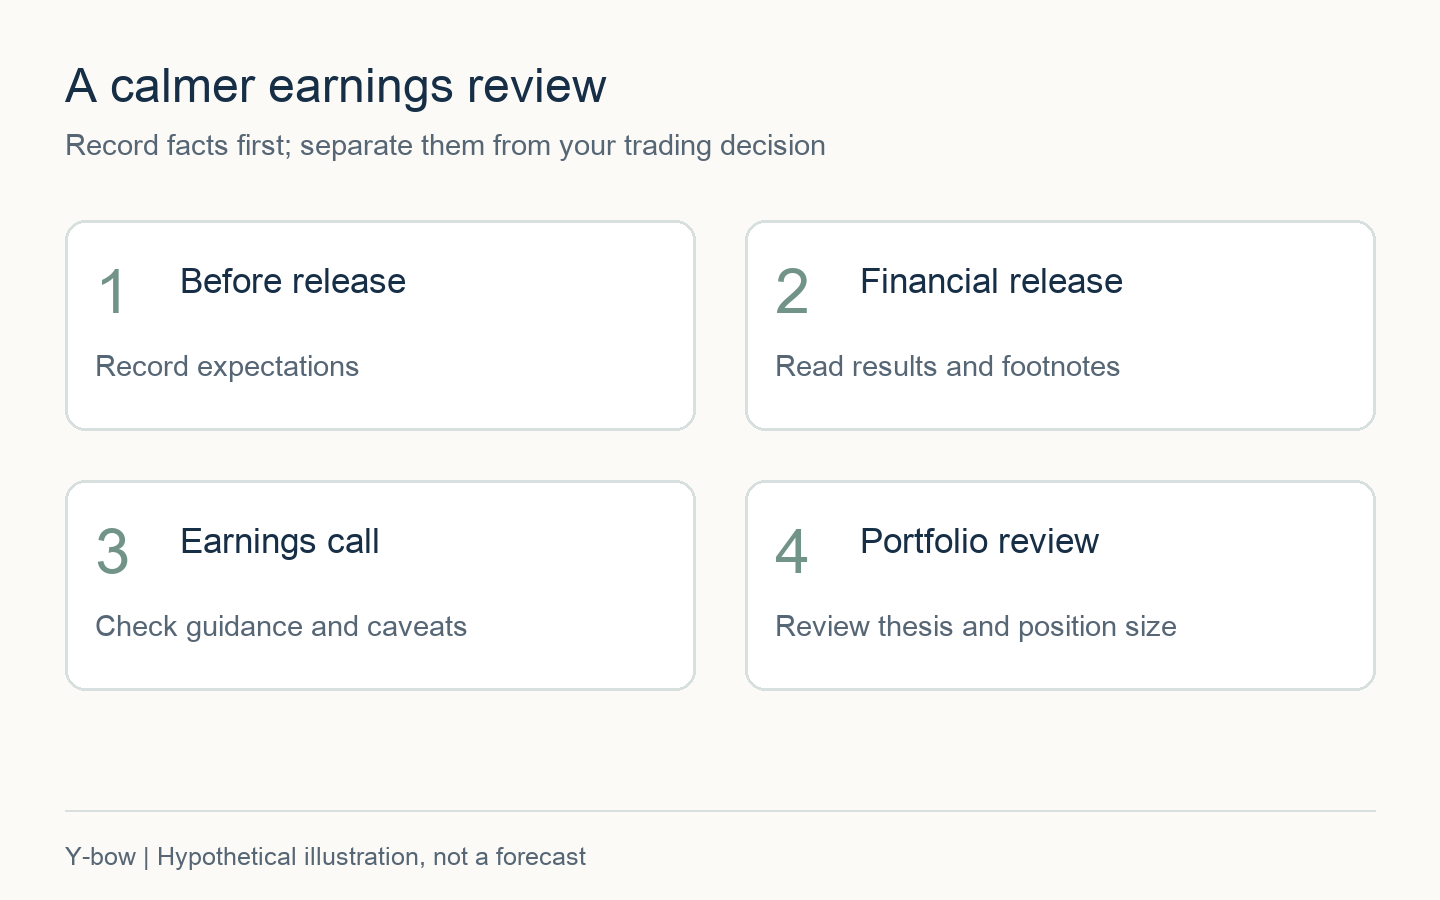
| Question | What to write down |
|---|---|
| 1. What was the benchmark? | Year-ago actual, guidance and timestamped consensus |
| 2. What changed in the outlook? | Revenue and margin ranges, with assumptions |
| 3. Is earnings growth repeatable? | One-offs, share count and product mix |
| 4. Is the cash commitment manageable? | Operating cash flow, capex, cash and debt |
| 5. Does the original thesis still hold? | Confirmed evidence and unresolved assumptions |
| 6. Is the position too large? | Concentration, other exposures and near-term cash needs |
| 7. What would change your view? | A specific future disclosure or business measure |
“It is a good company” is difficult to test. A more useful note might read: “I bought for a richer product mix and improving margins. Revenue increased, but margin recovery was delayed. I need to see the revised timing and funding requirement.” That note does not dictate a trade. It identifies the missing information and makes it harder to rewrite the thesis after every price change.
Long-term investing does not mean ignoring evidence that the original case has weakened. Equally, holding a sound business need not require keeping an oversized position. Company assessment and household risk are related but separate decisions. Exposure that threatens money needed soon can be unsuitable even if you remain positive about the business over several years.
Averaging down needs a reason beyond a lower price or a desire to repair the purchase price. The companion guide on chasing investment losses and the break-even trap explores that distinction. Leveraged funds add separate issues, including daily resets and financing costs; a checklist for an ordinary share does not remove those risks.
Frequently asked questions about stocks falling after an earnings beat
Is the post-earnings dip automatically a buying opportunity?
No. A reset in excessive expectations and a deterioration in the business can both produce a lower price. Compare today’s price with a realistic range of future outcomes. The previous high is not evidence of fair value or a promise that the stock will return there.
Should I sell every holding before earnings?
That is not a universal solution. It may avoid some losses and miss some gains, while adding trading costs and possible tax consequences. A more controllable starting point is how much exposure you are willing to carry through an uncertain announcement.
What if I do not have time to read every release?
Start with your largest positions and a small set of questions: outlook, margins and cash needs. If maintaining a company-level research process is unrealistic, a broadly diversified fund may be an alternative. Diversification reduces some company-specific exposure; it does not eliminate market losses.
Keep a decision record, not just a verdict on the quarter
Over 17 years of investing, I have found that a single attractive number rarely settles the case. A useful review asks what exceeded expectations, what changed in the outlook and how much the market is paying for the earnings. You do not need to predict every next-day move to improve the consistency of those questions.
For readers interested in the behavioral side of these decisions, the book below is relevant. It is not presented as an accounting textbook or a way to predict the next earnings reaction.
Sources, calculations and update policy
Primary references: TSMC Q3 2026 results, SEC: financial statements guide and SEC: non-GAAP financial measures. Checked October 19, 2026. Company guidance is not analyst consensus. This article does not establish the cause of a specific stock-price decline or identify the motives of particular sellers.
All original figures are hypothetical. Surprise = actual/comparison − 1; price example = EPS × P/E; FCF example = operating cash flow − capital expenditure. The TSMC revenue comparison is 46.72/45.8 − 1, approximately 2.01%. Figures are rounded. Recheck current filings, comparable estimates and their timestamps before making an investment decision. Material source, link or definition changes will be reviewed. This is an educational decision framework, not a recommendation to trade a particular security.








Comments