

“What is the S&P 500's average return?” sounds like a question with one numerical answer. In practice, a dividend yield, a one-year total return and an annualized return since 1993 can all appear on the same page. They are not interchangeable.
Before putting a percentage into a savings calculator, identify what it measures. A precise historical number can still be the wrong input for your plan. This article uses a dated SPY example, then shows how income, costs, inflation and currency change the interpretation.
Average S&P 500 return: label the period before quoting the number
The S&P 500 is a float-adjusted, market-capitalization-weighted benchmark for large U.S. companies. SPY is one investable fund tracking it; the ETF's return is not exactly the index return.
On the SPY issuer page, the following figures were shown for September 30, 2026. Fund figures are pre-investor-tax NAV total returns, with distributions reinvested; periods longer than one year are annualized.
| Period ending September 30, 2026 | SPY NAV return | S&P 500 benchmark return |
|---|---|---|
| 1 year | 15.60% | 15.74% |
| 5 years, annualized | 13.65% | 13.79% |
| 10 years, annualized | 15.18% | 15.33% |
| Since SPY inception, January 22, 1993, annualized | 10.82% | 10.95% |
These are historical measurements with different starting dates, not four forecasts. The issuer also reports a 0.0945% gross expense ratio. Fund operating expenses are already reflected in the reported fund performance; subtracting that ratio again would double count it. Your brokerage charges and personal taxes are separate.
Dividend yield is not the S&P 500's total return
Dividend yield measures income relative to a price or value under a stated convention. Total return combines investment price changes with distributions and a reinvestment assumption. The yield on a factsheet does not describe the full annual gain an investor should expect.
Suppose a fictional investment starts at $100, ends at $106 and pays $2 in cash during the year. Ignoring reinvestment timing, the gain is $8, or 8%, not just the 2% income component. If the ending price is $90, the same $2 distribution leaves a −8% total return. Income does not prevent a capital loss.
When a chart reinvests distributions, it tracks a different strategy from spending them. An investor cannot both spend a dividend and also receive the future compound return on that same money.
Cumulative return versus annualized return
A 100% cumulative gain means an investment doubled. Whether that is an exceptional annual result depends on how long it took. Doubling in ten years implies about 7.18% a year compounded; doubling in twenty years implies about 3.53%.
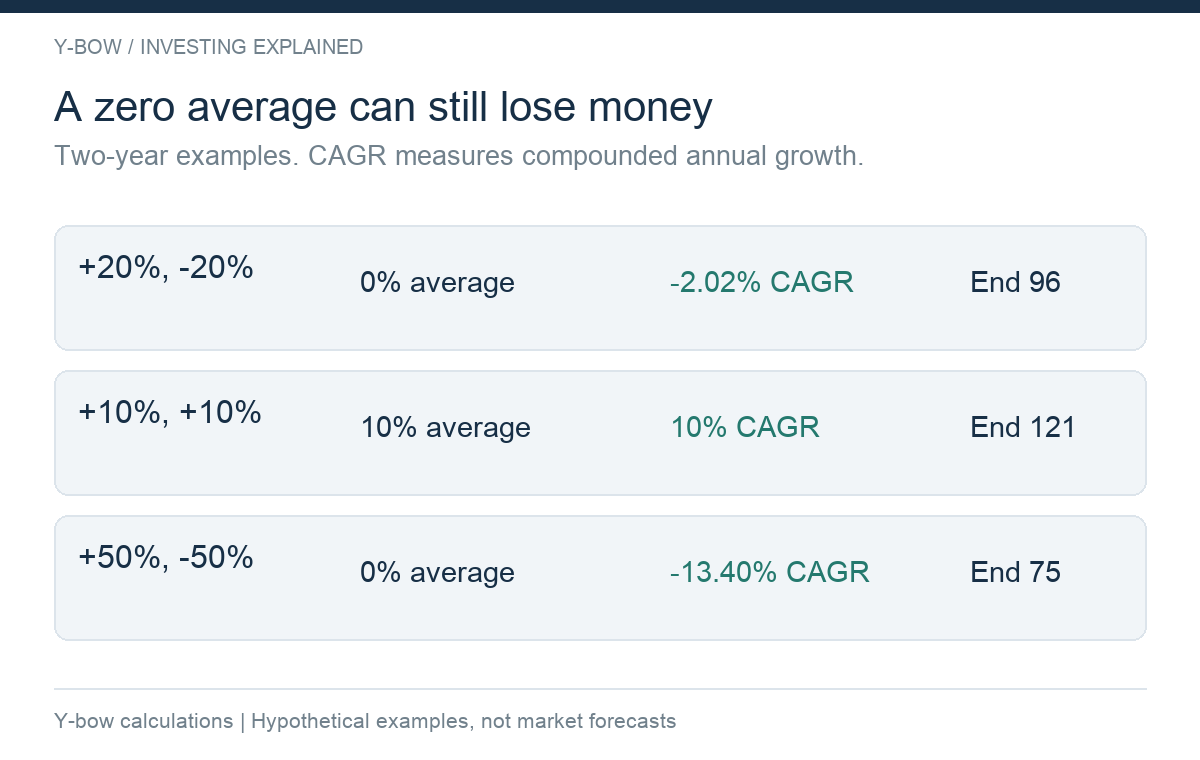
The calculation is (ending value ÷ starting value)^(1 ÷ years) − 1, assuming no intervening investor cash flows. This is the compound annual growth rate, or CAGR. Monthly deposits require a cash-flow-aware measure if you want your personal return.
| Hypothetical path, starting at 100 | Ending value | Arithmetic average annual return | CAGR |
|---|---|---|---|
| +20%, then −20% | 96 | 0% | −2.02% |
| +10%, then +10% | 121 | 10% | 10% |
| +50%, then −50% | 75 | 0% | −13.40% |
The average of the percentages can hide a loss. See our CAGR and average-return guide for the distinction; the table above is original arithmetic, not S&P 500 history.
Why a long-run average is a poor one-year budget
Imagine funding a $10,000 bill next year by assuming a 10% gain on $9,091. The arithmetic works if the assumed gain arrives. It does not tell you the probability of a shortfall, the size of a possible loss or what happens if you must sell during a decline.
An annualized historical return compresses a whole sequence into one steady-growth equivalent. It does not say the investment grew smoothly. A 10% CAGR can include years with large losses. The average also depends on the starting valuation and ending date.
Use separate planning assumptions rather than one optimistic number. For example, you could calculate what a target requires with no growth and with several explicitly hypothetical growth rates. The comparison reveals how much the plan depends on investment returns rather than contributions. It does not turn those rates into forecasts.
Inflation changes the return you can spend
The exact relationship is (1 + nominal return) ÷ (1 + inflation) − 1. In an invented year with an 8% investment return and 3% inflation, the real return is about 4.85%, before personal taxes and additional charges.
Subtracting inflation gives a useful approximation for small percentages, but the ratio is more accurate. For a plan measured over many years, specify the price measure and period used. A household whose spending differs substantially from the index basket may experience something different again.
Tax can complicate the picture: a taxable nominal gain may leave less real spending power than the pre-tax chart suggests. Treatment depends on residence, account type, distributions and transactions. A U.S. fund's standardized after-tax example is not a personal tax calculation for readers everywhere.
Currency can turn a dollar gain into a local-currency loss
Suppose an unhedged dollar investment gains 10%, while a dollar loses 15% of its value in your spending currency. The combined return is 1.10 × 0.85 − 1 = −6.5%. If the dollar instead appreciates 15%, the same investment gain becomes 26.5% in that currency.
Both are hypothetical, before costs and taxes. A currency-hedged fund introduces a different implementation and cost structure; simply buying a fund through a local exchange does not establish that its currency risk is hedged.
Do not compare a dollar S&P 500 chart with a local-currency savings account and call the difference an investment return advantage without making the measurement consistent.
Monthly investing: separate contributions from profits
An ending account value of $30,000 means little without knowing the deposits. If you contributed $28,000, most of that balance is saved money. If you contributed $10,000 at the start and nothing else, the interpretation is very different.
For a recurring-investment comparison, record the amount, frequency and timing of contributions. Then show total contributed principal separately from ending value. Include the same contribution schedule for each asset. Avoid silently changing from an initial lump sum to monthly investing halfway through an argument.
For withdrawals, also record whether spending is fixed, inflation-adjusted or a percentage of the current balance. A return table alone cannot establish that an account will fund retirement.
A checklist for reading any S&P 500 return claim
Before using a number, write down six labels: dates, currency, distributions, costs, tax basis and cash flows. If a source omits one, investigate it before comparing two percentages.
A historical return is useful evidence about a stated investment and period. It is not an interest rate offered to you today. The most practical next step is to pair this measurement with a plan for S&P 500 declines and recovery, rather than treating an attractive average as a substitute for one.
Sources and issuer figures checked October 15, 2026. The table of published returns retains its September 30, 2026 measurement date. All other numerical examples and the figure are original hypothetical Y-bow calculations, not forecasts.










Comments