

India's growth story and the return from a leveraged India ETF are different things. A growing population does not tell you the price you are paying for listed companies, the currency return or the effect of resetting leverage every day.
INDL is a useful example of why those distinctions matter. The right starting point is its benchmark and daily objective, followed by an actual calculation. “India will grow” is too broad a reason to explain what this particular instrument will do.
What is INDL, and which India index does it follow?
Direxion's INDL product page states a target of 200% of the MSCI India Index's daily performance before fees and expenses. The issuer's factsheet describes the index as large- and mid-cap Indian equities, covering approximately 85% of the Indian equity universe.
That is a listed-equity basket, not India's GDP, every business in the country or every new company that might benefit from growth. The holdings and their weights determine what you own indirectly.
At this article's check date, the issuer displayed gross and net annual expense ratios of 1.23%. Its footnote distinguishes acquired-fund expenses from other costs and excludes certain financing expenses from the expense-limitation arrangement. Read the current prospectus rather than treating the headline ratio as an all-in cost quote.
Daily 2x leverage is not twice India's long-term return
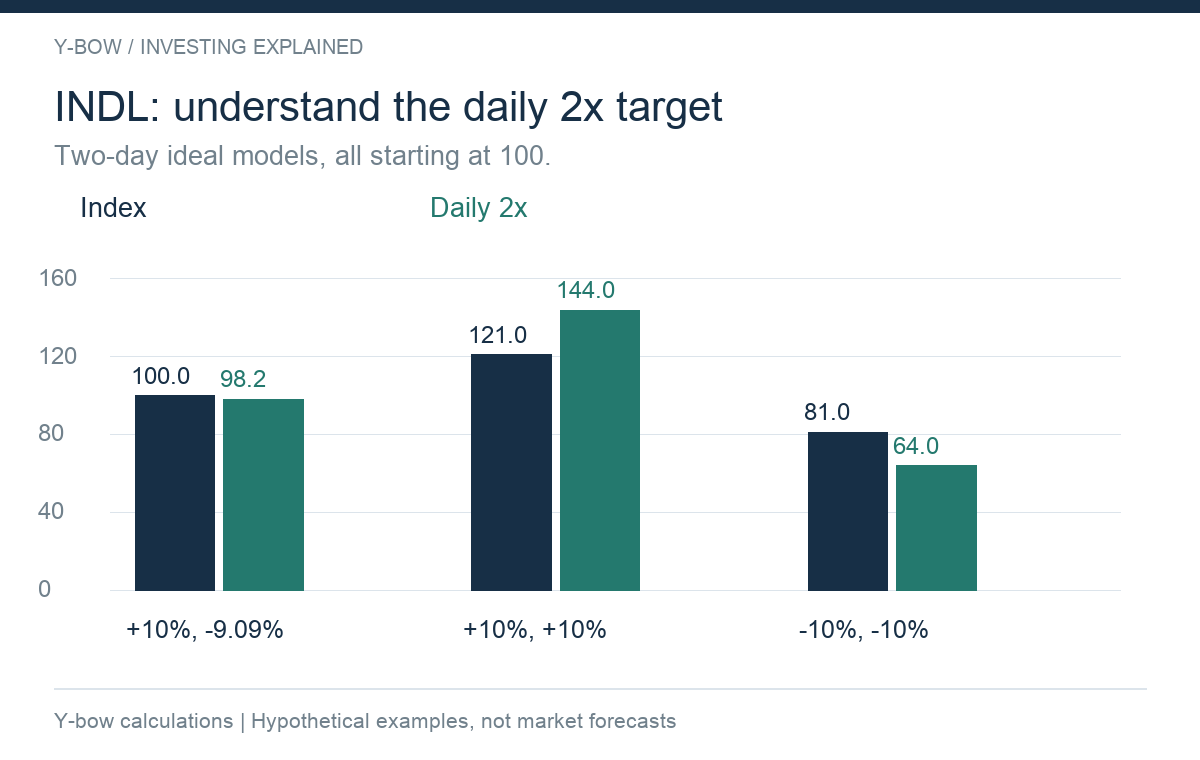
Suppose an index starts at 100, rises 10% and then falls 9.0909%. It finishes back at 100. A theoretical daily 2x position rises to 120, then falls 18.1818%, finishing near 98.18. A flat two-day index return did not produce a flat leveraged result.
Now suppose the index rises 10% on each of two days. Its final value is 121, while the theoretical daily 2x position finishes at 144. The 44% gain is more than twice the index's 21% gain. Daily compounding can help in one path and hurt in another.
| Hypothetical index path | Index ending value | Daily 2x ending value |
|---|---|---|
| +10%, −9.0909% | 100.00 | 98.18 |
| +10%, +10% | 121.00 | 144.00 |
| −10%, −10% | 81.00 | 64.00 |
All paths start at 100 and omit costs, tracking differences and taxes. They are not INDL results or a model of its future performance. They explain why the holding period alone cannot determine whether daily leverage will work well.
Economic growth, corporate earnings and valuation are separate
Consider a fictional company's earnings rising from $1 to $1.20 per share. At 30 times earnings, the share starts at $30. If investors later pay 20 times earnings, the price becomes $24 despite the 20% earnings growth. The share-price return is −20%, before dividends.
The same distinction applies to a country investment. You need to assess what growth is already reflected in prices, which listed companies benefit, whether shareholders receive the earnings and how much further investment is needed. A promising economy can be an expensive stock market.
An index can also be concentrated in a few sectors or large groups. Read the dated holdings instead of assuming “India” gives evenly spread exposure to the entire economy. Compare that basket with a broad emerging-market holding before deciding what INDL adds.
Currency exposure: a U.S. listing does not remove foreign-exchange risk
INDL trades in dollars, but the underlying equity exposure is Indian. Dollar trading is the currency of the ETF transaction; it does not make Indian companies' local-currency economics disappear.
For a simplified unhedged, unleveraged example, local shares rising 12% while the local currency loses 10% against the dollar produce 1.12 × 0.90 − 1 = 0.8% in dollars. This is not a formula for INDL's realized return: its daily reset, benchmark convention and costs must also be included.
If you spend in another currency, there is another conversion from dollars into that spending currency. Keep the measurement currency consistent when comparing the ETF with a domestic India fund or another international investment.
The risk is not confined to the annual expense ratio
Write out the round-trip trade. A buyer pays the ask; a seller receives the bid. Commissions, conversion charges and the difference between market price and net asset value can matter. A low share price does not mean a small percentage spread.
For example, a bid of $39.90 and ask of $40.10 create a $0.20 spread, or 0.5% of the $40 midpoint. That is an invented quote, not an observed INDL spread. It shows why checking the order book is useful before assuming the expense ratio is the only friction.
Consider the hours when underlying markets are open, the trading venue and the type of order. Do not assume a stop order guarantees your chosen exit price if prices gap. Specify how much capital you are prepared to expose before a trade becomes difficult to close.
How much India exposure would the position add?
A 5% allocation to a daily 2x fund represents roughly 10% of portfolio value in targeted daily benchmark exposure at the starting point, assuming the rest is cash. It does not mean a guaranteed 10% portfolio loss if the index falls 100%, nor does it remain a fixed allocation as prices change.
If the other 95% already contains emerging-market equities, inspect the India overlap. Country exposure, issuer concentration and leverage are separate columns in a portfolio review. Counting tickers does not count independent risks.
A cash purchase of ETF shares also differs from buying those shares on margin. Borrowing at account level adds obligations beyond the fund's internal exposure. See our daily-leverage risk controls for a broader checklist.
Before treating INDL as a long-term India investment
Ask yourself which outcome you are trying to obtain. If it is broad participation in Indian equities, compare unleveraged alternatives on matching dates and a matching currency basis. If it is a tactical leveraged position, identify the time horizon, monitoring routine, position size and exit condition.
Do not compare a current 2x objective with an entire historical fund series without checking objective changes. Nor should a chart ending in a favourable period become a permanent ranking of India against other markets.
Practical check: could you still explain the position if the economy grew, the benchmark fell and INDL fell more? If the investment case has no answer to that combination, it has not yet addressed the product's main risks.
Product information checked October 15, 2026. Numerical scenarios and the figure are original Y-bow calculations, not actual fund performance. The SEC's leveraged-ETF bulletin provides an additional explanation of daily objectives. Availability and tax treatment depend on the investor's jurisdiction.










Comments