

Does one AI conversation use a bottle of water? Or is the footprint closer to a few drops? Both versions circulate widely, and the gap is large enough to make the whole subject feel unreliable.
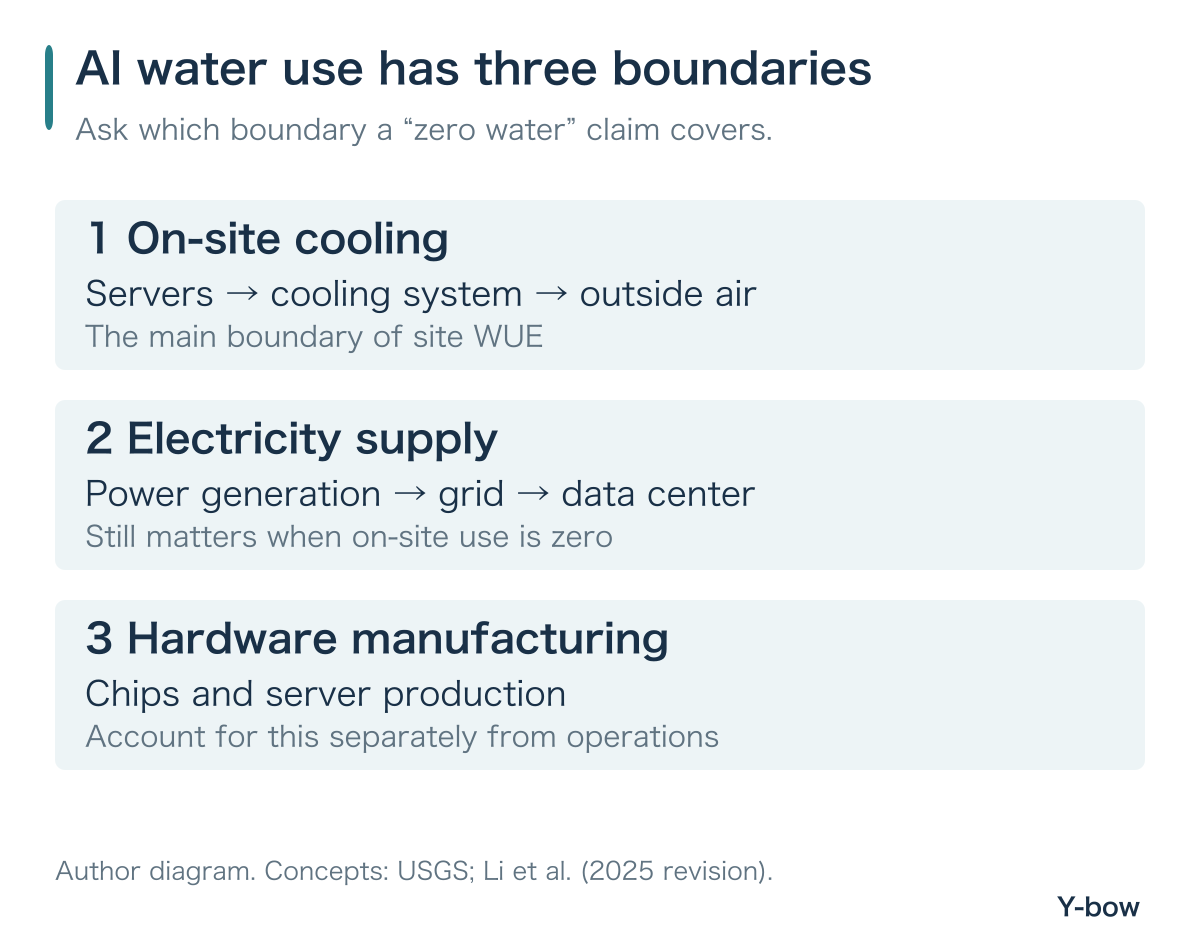
The first question I would ask is simpler: what exactly was counted? A chatbot response, a data center’s cooling system, the power stations supplying it and the factories making its chips are different things. Mixing their numbers can produce a striking headline and a weak comparison.
This matters beyond personal AI use. For investors following semiconductors and cloud infrastructure, water can affect a project’s location, cooling design, operating costs and opening date. A server order is useful only if the customer can eventually put those servers to work.
This guide explains AI data center water consumption, the limits of per-prompt estimates and WUE, and a reproducible calculation you can use when reading an infrastructure announcement. It complements our guide to AI data center electricity demand, PUE and investing.
Three distinctions to keep
- Separate on-site cooling, electricity-related water and hardware manufacturing.
- Liquid cooling, zero-water cooling and lower WUE are different claims.
- A smaller footprint per request can coexist with a larger annual footprint.
Sources checked October 16, 2026. Company disclosures, historical estimates and hypothetical calculations are identified separately. The featured image is an AI-generated editorial illustration, not a photograph of a real facility.
Why do AI data centers use water?
On-site cooling is only the first boundary
Computing produces heat. A data center must move that heat away from its equipment and ultimately into the environment. When the heat-rejection system relies on evaporation, the water that evaporates needs replacing.
Water circulating through a pipe is different from new water entering the site. Counting the same water every time it passes a server would confuse circulation with consumption. That is one reason photographs of liquid-cooled racks tell us little about a facility’s annual water footprint.
Electricity supply and manufacturing sit outside the fence
Power generation can have a separate water footprint. In its 2024 report, Berkeley Lab estimated approximately 66 billion liters of direct water consumption and nearly 800 billion liters of electricity-related indirect consumption for U.S. data centers in 2023. These are historical modeled estimates for all data centers, not AI alone or a current reading for an individual campus. Source: Berkeley Lab’s 2024 report.
There is also water associated with manufacturing chips and servers. That belongs in a life-cycle assessment, rather than being silently added to a cooling-only figure. The separation of on-site, electricity-related and supply-chain water is discussed in Li and colleagues’ paper, revised in 2025.
Water withdrawal vs water consumption: why the distinction matters
Withdrawal means removing water from a source. Consumption is the portion no longer available for immediate local reuse, for example because it evaporated. USGS distinguishes these concepts in its explanation of water use.
In a simplified example, withdrawing 100 liters and returning 80 liters to the same local water system leaves 20 liters consumed. That arithmetic does not settle the environmental question: return-water quality, discharge location and seasonal conditions still matter.
| Question | What to check |
|---|---|
| Which volume? | Withdrawal, consumption or circulation? |
| Which source? | Potable water, groundwater, surface water or reclaimed water? |
| Which boundary? | Cooling only, electricity supply, or manufacturing as well? |
| Which period? | Annual average, summer peak, historical result or design target? |
| Which evidence? | Measured data, modeled estimate or a company commitment? |
A global annual total cannot tell a community how much water a particular site will need on its hottest day. Conversely, one water-intensive site cannot establish the footprint of every AI request worldwide. Both are useful observations at different scales.
How much water does one AI prompt use?
Google’s 0.26 mL estimate has a specific scope
Google’s August 2025 disclosure estimated 0.26 milliliters of water and 0.24 watt-hours for the median Gemini Apps text prompt in May 2025. The water estimate used 2024 fleetwide average WUE. It is not a current average for all AI products; Google’s note also says the claims were not independently verified. Source and methodological notes: Google.
That distinction matters when a request involves a long reasoning process, image generation or an agent calling tools repeatedly. “One request” is not a standardized unit of useful work. The right comparison needs a defined task and a similar service level.
The bottle-of-water estimate is not a universal meter
Li and colleagues’ revised 2025 paper gives an illustrative estimate of 500 mL for roughly 10–50 medium-length GPT-3 responses, varying by place and time and including electricity-related water. This is a model-based example, not a direct measurement of today’s ChatGPT traffic. Source: the paper’s inference assumptions.
It would be misleading to divide that figure by Google’s figure and present the result as a measured efficiency improvement. The models, periods, workloads and accounting boundaries differ. A missing comparison is better left missing than filled with a precise but unsupported ratio.
What is WUE, and how do you calculate annual water use?
Water Usage Effectiveness, or WUE, relates a water volume to an energy quantity, usually in liters per kilowatt-hour. Before using it, check both the numerator and denominator. Is it withdrawal or consumption? Is energy measured at the IT equipment or the whole facility?
Microsoft’s disclosure defines its WUE using annual humidification and cooling water divided by IT electricity. Its FY25 global figure is 0.27 L/kWh for the stated owned-and-controlled facility population, covering July 2024–June 2025. Treat that as the disclosed water-use measure rather than automatically ranking it against another company’s consumption-based metric. Source: Microsoft’s definition, scope and regional data.
A 100 MW example, with assumptions stated
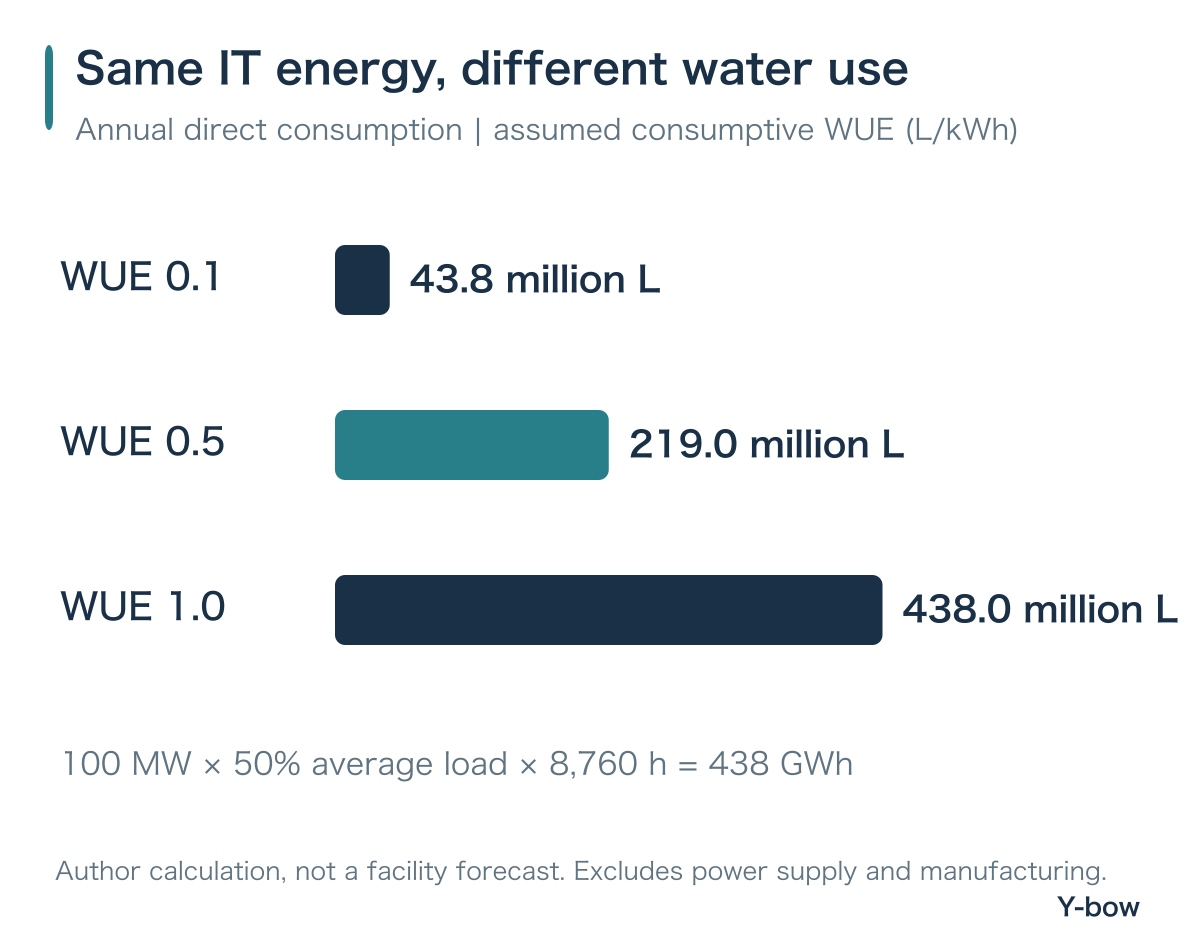
The following is a calculation exercise, not a forecast for an actual campus. Assume 100 MW of IT capacity, an average electrical load equal to 50% of that capacity and 8,760 hours in the year. Electrical load is not the same as GPU utilization.
100 MW × 50% × 8,760 hours = 438,000 MWh = 438 million kWh.
Now assume a consumption-based, on-site WUE of 0.5 L per IT kWh. Annual direct consumption would be 219 million liters, or 219,000 cubic meters. The assumed WUE is an illustrative input, not a company average.
| Assumed WUE | Million liters | Million U.S. gallons |
|---|---|---|
| 0.1 L/kWh | 43.8 | 11.6 |
| 0.5 L/kWh | 219.0 | 57.9 |
| 1.0 L/kWh | 438.0 | 115.7 |
The exercise also shows why a headline such as “a 100 MW data center” is insufficient. Does 100 MW refer to IT capacity or a facility’s connection? What is its actual average load? What is the WUE definition? Those questions come before the multiplication.
Where PUE belongs in the calculation
Assume PUE is 1.2: facility electricity would then be 525.6 GWh. If electricity-related consumption were hypothetically 1 L per facility kWh, indirect water consumption would be 525.6 million liters. Add the 219 million liters of direct consumption and the operational total would be 744.6 million liters.
The formula is IT energy × direct consumptive WUE + IT energy × PUE × grid water intensity. PUE and grid intensity here are assumptions, not universal averages. Manufacturing remains outside this example.
Do not multiply direct WUE by PUE again when its denominator is already IT energy. Also avoid adding a withdrawal figure to a consumption figure and calling the result total consumption. Getting the boundary right matters more than reporting an extra decimal place.
Does liquid cooling mean zero water consumption?
Liquid cooling describes how heat moves away from equipment. It does not, by itself, specify how that heat is ultimately rejected outside the building. A closed liquid circuit near a chip can coexist with evaporative equipment elsewhere in a facility.
Microsoft has described a new design that recirculates coolant without evaporation for operational cooling. That does not make the water associated with all its facilities, electricity supply and manufacturing disappear. Source: Microsoft’s June 2026 cooling explanation.
| Description | Next question |
|---|---|
| Evaporative cooling | What are summer make-up requirements and the source of water? |
| Closed-loop liquid cooling | What equipment rejects the heat outside that loop? |
| Dry heat rejection | How do energy demand and capacity change in hot weather? |
| Zero-water cooling | Does the claim cover operational cooling only? What is excluded? |
My practical reading method is to follow the heat: chip, coolant, heat exchanger, outside air. At each step, ask whether water is replenished and what power is required. This is more informative than treating “liquid-cooled” as an environmental verdict.
Why lower water use per prompt may not lower total use
Suppose water consumption per request falls 40%. With an unchanged number of requests, the total falls 40% too. If requests double, the total becomes 2 × 0.6 = 1.2 times the original level.
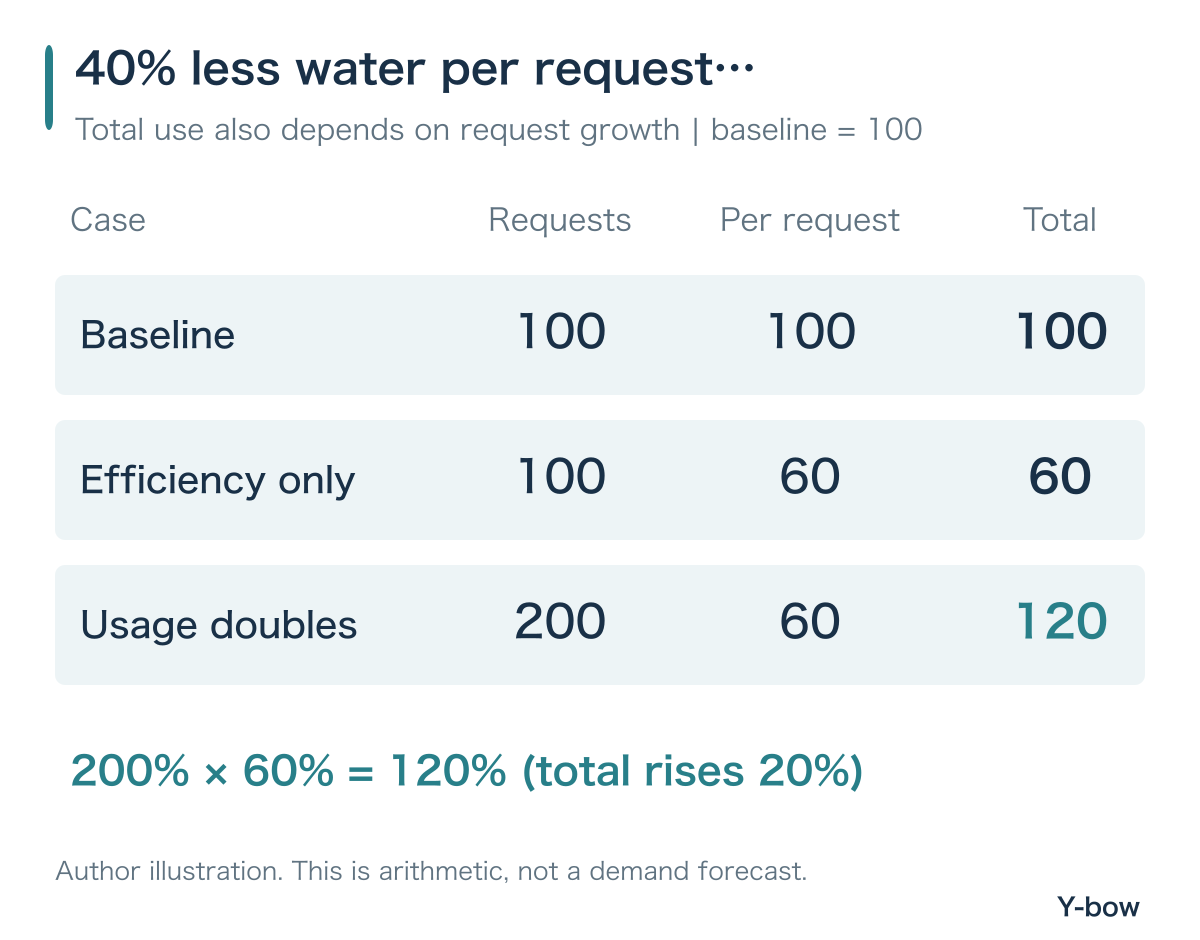
This does not mean efficiency is pointless. Nor does it prove that demand must always grow faster than efficiency improves. It means any forecast needs two assumptions: resource use per unit of work and the amount of work being done.
For investors, the same distinction helps when reading claims that more efficient AI will either destroy semiconductor demand or guarantee another equipment boom. Neither conclusion follows from efficiency alone. Workload mix, prices, customer adoption and hardware replacement schedules all need their own evidence.
What should AI infrastructure investors check?
In its October 14, 2026 report, the IEA says nearly 40% of identified AI-dedicated data center capacity is in areas with high or extremely high baseline water stress. That is an exposure measure, not a prediction that 40% will shut down. Source: IEA, Powering Artificial Intelligence.
I would translate that exposure into project-level questions. Can the operator secure supply? Would a different cooling design change construction costs or electricity requirements? Could a delayed permit affect the opening date? These are hypotheses to test against contracts and disclosures, not automatic reasons to buy or sell.
| Business | Evidence to seek |
|---|---|
| Data center operator | Permits, water arrangements, drought restrictions, energized capacity and actual occupancy. |
| Cooling supplier | Firm orders, delivery dates, revenue recognition, margins and service contracts. |
| Water-treatment supplier | The specific process supplied and separately disclosed AI-related revenue. |
| Chip or memory maker | Whether customer delays change deliveries; distinguish customer sites from its own fabs. |
| Equity valuation | What growth is already priced in, and whether orders become earnings and cash flow. |
“AI needs water” is not a complete investment case for every water company. An equipment supplier can win more business without earning attractive margins. A customer can build a much larger campus without delivering the shareholder return implied by its starting valuation.
For a related example of separating business growth from share-market mechanics, see our analysis of SK hynix, Micron and Samsung buybacks and index flows.
Frequently asked questions about AI and water
Does my tap run when I use AI?
No. A per-request footprint allocates resource use at data centers and elsewhere in the supply chain to a task. The user and the affected water basin may be far apart.
Can replenishment cancel a local water constraint?
Not automatically. Ask where the project happens, when benefits occur and whether the measurement represents additional water availability. A balanced global annual number cannot, by itself, establish reliable supply for one hot afternoon in a particular basin.
What if a provider does not publish a per-prompt figure?
Start with disclosed annual site or regional water volumes, electricity and metric definitions. Leave unavailable inputs marked unknown. Borrowing another provider’s WUE to produce a precise-looking answer can hide more uncertainty than it resolves.
Is the lowest WUE always the best choice?
A comparison needs the same definition and boundary. Beyond that, assess electricity requirements, water source, local conditions and reliability. A single ratio is a useful clue rather than a complete assessment.
How I would read the next AI water headline
Identify the place, period and accounting boundary first. Check whether the claim describes a request, an annual total or a design target. Then ask what a cooling change does to costs, power requirements and operating conditions.
That sequence works for an alarming bottle-of-water claim and an optimistic zero-water announcement alike. The useful question is what improved under comparable conditions, and which burdens remain outside the reported boundary.
Continue with AI data center power demand: PUE, grids and investing for the electricity side of the same infrastructure problem.
This article combines public sources with the author’s analysis and illustrative arithmetic. It is educational information, not a recommendation to trade a security. Assumptions and exclusions are stated alongside the original figures.
Sources and original-figure methodology
Primary sources are linked beside the relevant claims. Google also published a technical paper in August 2025. The Berkeley Lab water figures are historical estimates for 2023, not 2026 observations. Corporate disclosures are identified as such.
Figure 1 organizes accounting boundaries. Figures 2 and 3 are original calculations using the stated assumptions; no source charts are reproduced. The numerical exercise excludes manufacturing and distinguishes direct consumption from electricity-related consumption. Compare real facilities only after aligning metric definitions, reporting periods and coverage.








Comments