

Selling investments to pay the bills feels different from receiving a monthly distribution. You can see the share count falling when you sell. With an income ETF, the shares may stay put and cash arrives in the account. It is easy to read that difference as “spending income” versus “spending my capital.”
But an unchanged share count does not guarantee an unchanged nest egg. A distribution can arrive while the holding’s value falls. A share sale can reduce the number of shares while the remaining investment grows. The useful comparison is cash available for spending and the assets left afterward.
Sources checked October 25, 2026. US-listed JEPQ and QQQM. Original diagrams use explicitly hypothetical arithmetic, not a historical withdrawal backtest for either fund.
JEPQ vs QQQM: different strategies, not just different payouts
JPMorgan Nasdaq Equity Premium Income ETF, or JEPQ, combines an actively selected equity portfolio with equity-linked notes, or ELNs, incorporating written call exposure. Its objective combines income and capital appreciation. It is not simply QQQM with extra cash added on top.
The November 1, 2025 summary prospectus permits up to 20% of net assets in ELNs. That limit is not a promise that exactly 80% is always ordinary shares. ELNs add counterparty and liquidity risks, and the written-call component exchanges some upside participation for option economics.
Invesco NASDAQ 100 ETF, QQQM, seeks to track the Nasdaq-100. It does not target a fixed monthly payment matched to a household budget. If its distributions are less than your required spending, you need another source of cash, which could include selling shares.
| Feature | JEPQ | QQQM |
|---|---|---|
| Approach | Active equities plus ELNs | Nasdaq-100 index tracking |
| Income design | Seeks income and appreciation; monthly distributions sought | Index participation; spending managed separately |
| Annual fund expenses | 0.35% | 0.15% |
| Inception | May 3, 2022 | October 13, 2020 |
| Key checks | Variable distributions, ELN risk, upside trade-off | Equity losses, concentration, sale amount and timing |
Expenses and inception dates: official JEPQ factsheet and QQQM brochure, September 30, 2026. Fund expenses are not an all-in figure for your brokerage, taxes and currency costs.
JEPQ is not the same covered-call strategy as QYLD
JEPQ’s stock selection and ELN terms matter. Do not assume it owns precisely QQQM’s portfolio, or mechanically writes the same calls as a different fund. The broader QYLD and XYLD total-return guide explains why covered-call labels and distribution yields are not enough to establish that two products are interchangeable.
Does receiving distributions preserve principal?
A distribution is not money created outside the investment. Other things equal, a fund’s value adjusts for the amount paid out. Market moves can obscure the adjustment in a price chart, but keeping the same number of shares does not mean the pre-payment value remains invested too.
Returns may exceed withdrawals and allow assets to grow, or losses and spending may reduce them. The share count alone cannot tell you which happened. Track what reached the household and what remains across the whole investment account.
A $100 distribution is not automatically $100 of extra wealth
Consider an imaginary investment worth $10,200 before spending. It pays a $100 distribution, leaving $10,100 invested and $100 cash. Spend $50 and reinvest the other $50: $10,150 remains invested.
Alternatively, start with the same $10,200, receive no distribution and sell $50 for spending. Again, $10,150 remains. Ignore taxes, transaction costs and price changes around the payment for this illustration.
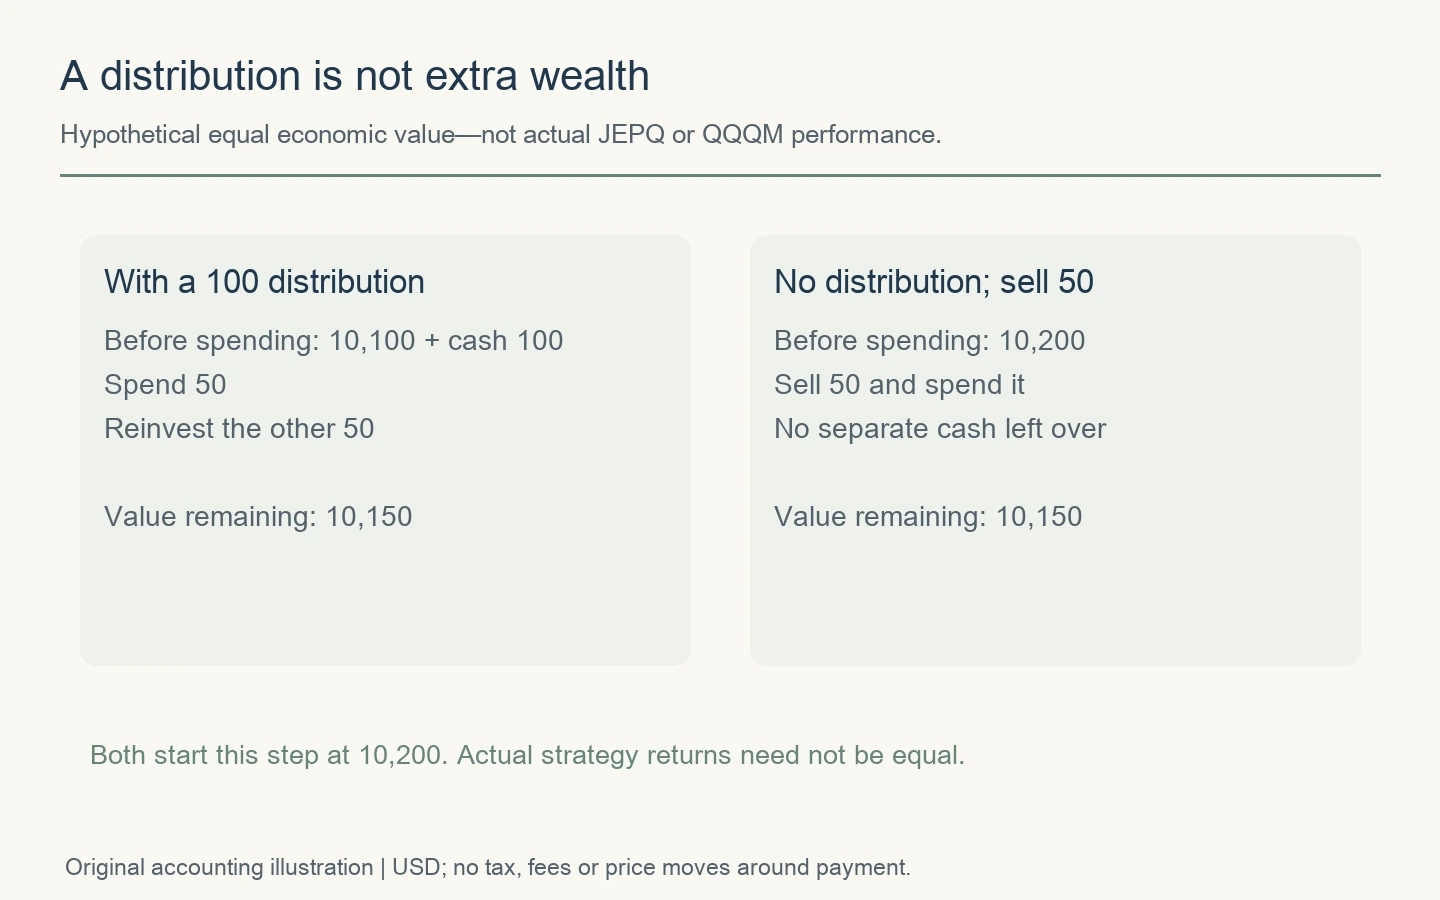
Actual JEPQ and QQQM portfolios will not reliably arrive at the same pre-spending value. The example isolates the cash-payment mechanism; it does not make the strategies equivalent or predict which will fund a budget better.
Advertisement
Distribution yield, SEC yield and total return are different measures
A distribution yield relates a defined set of payouts to a price or NAV. Read the calculation period and denominator. Annualizing the latest payment is not the same as summing the last twelve months, and neither is a promise about the next twelve.
The 30-day SEC yield is a standardized income measure. It is not a total return including capital appreciation. Particularly for an option-income strategy, a distribution measure and a standardized income yield need separate interpretation. A household cannot treat either headline percentage as a guaranteed payment schedule.
Total return considers investment-value changes and distributions together. If a published performance series assumes reinvestment, adding a distribution yield to that return counts the payout again. A high distribution rate can coexist with a lower total return.
A dated performance comparison—and its limits
| Period | JEPQ | QQQM |
|---|---|---|
| One year | 19.45% | 23.79% |
| Three years, annualized | 21.84% | 28.11% |
From the issuer documents linked above. These are reinvestment-based NAV total returns, not remaining balances after living-expense withdrawals. Three-year figures are annualized, not cumulative. Taxes, actual trades and currency conversion can change investor outcomes. Past performance does not determine the next period’s ranking.
QQQM’s return was higher over these specified windows. That does not settle every income investor’s choice or establish future superiority. It also does not license adding JEPQ’s payout yield to its reported return to reverse the ranking. Distribution variability, losses, taxes and investor behavior belong in the assessment.
JEPQ launched in 2022. A “twenty-year JEPQ backtest” built from another index or an invented option strategy is not twenty years of actual JEPQ results. This article does not reconstruct a complete historical monthly NAV and distribution ledger; the cash-flow examples below are deliberately hypothetical.
What happens when you withdraw during a market decline?
With share sales, a fixed dollar withdrawal generally requires more shares when the price is lower. An income fund does not remove the underlying spending problem. If distributions fall short, you still need a sale, other cash or lower spending. If the remaining portfolio declines, an unchanged share count does not repair it.
Take two imaginary periods, starting with $10,000 and spending $500 at each period end. A 20% loss followed by a 25% gain returns an untouched investment to its starting value. Reverse those same returns and the untouched investment also returns to its starting value.
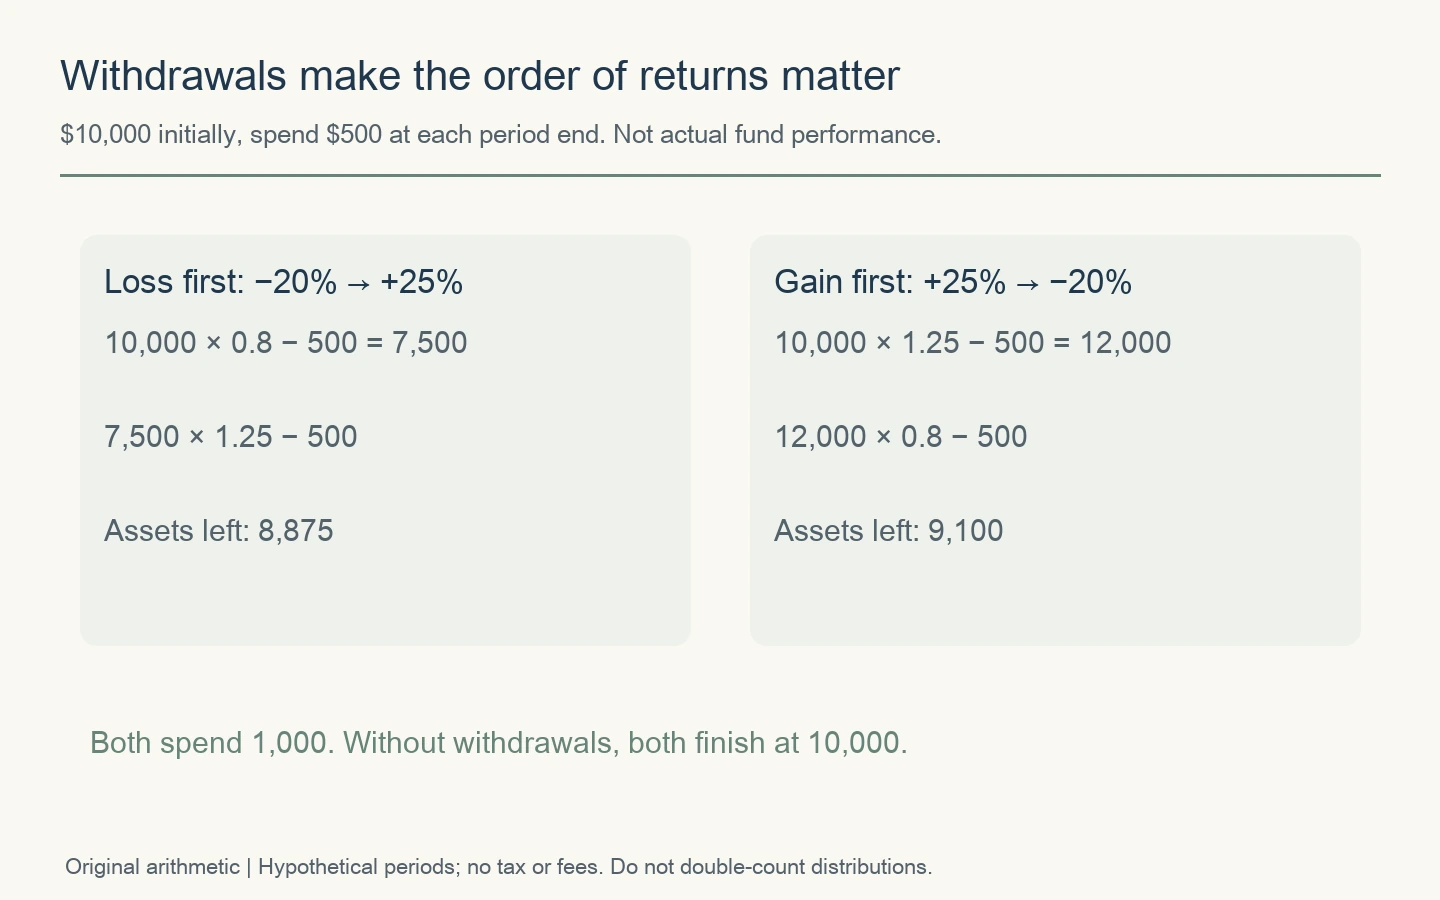
With the withdrawals, loss first leaves $8,875; gain first leaves $9,100. Both households spent $1,000. This is a simple example of sequence-of-returns risk. External spending makes the ordering matter. Do not confuse it with rearranging multiplication factors in a buy-and-hold account with no flows.
An income strategy also needs monitoring of spending and remaining wealth. “I have not sold a share” is not enough evidence that future bills are funded. Define what spending can be reduced, what money must be held elsewhere and what would trigger a review before the decline occurs.
How to compare JEPQ distributions with QQQM withdrawals fairly
- Choose the same starting date, capital and spending currency.
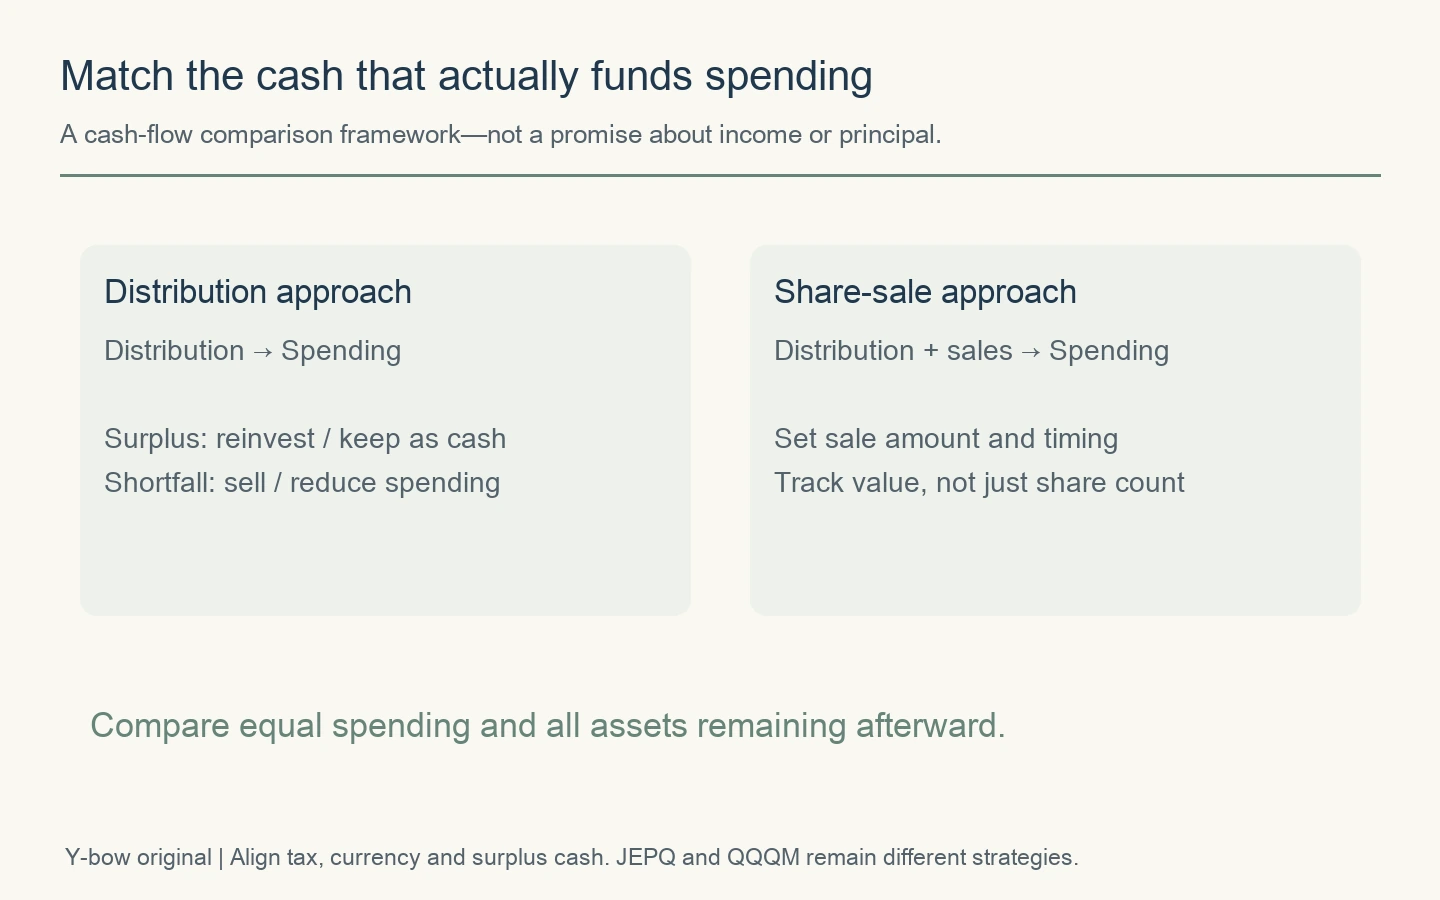
- Set the spending amount and the timing of distributions and sales.
- Reinvest surplus distributions or record them as separate cash.
- Fund shortfalls explicitly. If spending changes, disclose the change.
- Include taxes, spreads, commissions and conversion costs where applicable; count all remaining cash.
A $500 monthly-spending test should not quietly let one account spend $600 while the other spends $500. Nor should it discard the extra $100 when the income account retains it. Both the money spent and the money left must be reconciled. Payment dates matter if the household needs cash before a distribution arrives.
For a historical test, use either a raw NAV-plus-distributions ledger with actual share counts, or a correctly constructed total-return framework. Do not add payouts again to an adjusted series that already includes them. Reinvestment dates, fractional shares and sale timing also need stated rules. Otherwise, the apparent precision of a long chart can hide inconsistent accounting.
Tax residence and spending currency can change the comparison
A US taxable account, a retirement account and a non-US investor’s account can produce different after-tax results. Distribution classifications in US documents do not establish another country’s treatment. Do not assume every payment is tax-free return of capital, or that realizing a sale has the same tax cost for every reader. Check the applicable rules and account terms rather than borrowing another investor’s tax conclusion.
Dollar cash also does not guarantee a fixed euro, pound or yen budget. If the household spends another currency, a constant dollar distribution may buy a different amount of essentials next month. State the spending currency and exchange-rate convention before calling one stream more stable.
Turn the comfort of monthly income into a workable plan
Regular deposits may help some investors avoid unnecessary trading. That usability can matter. It should be described as a possible behavioral benefit, not principal protection. Ask what happens if the payment shrinks, expenses rise or a difficult market lasts longer than expected.
A share-sale approach also requires more than saying “just sell a little.” Choose an amount, schedule, account and cash-replenishment rule. Judge it by spending funded and wealth remaining, rather than interpreting every fall in the share count as failure.
For JEPQ, understand the variable payments, active portfolio and ELN trade-off. For QQQM, understand index concentration and the practical sale process through declines. After equal spending, review the whole remaining account. That is the common starting point for deciding whether an income distribution or a planned withdrawal better fits the job.
For more on withdrawals and severe equity losses, see Nasdaq-100 crash and withdrawal risk. The goal is a process that can be maintained under stress, not a yield number that looks reassuring on purchase day.
Primary sources, calculations and updates
Sources: JEPQ summary prospectus dated November 1, 2025, the JEPQ factsheet and Invesco’s QQQM brochure, with the latter two reporting September 30, 2026 data. Effective document dates and performance dates are separate checks.
All three diagrams are original. The sequence example uses Vₜ = Vₜ₋₁ × (1 + rₜ) − 500. The accounting example and two-period returns are hypothetical, not estimated fund outcomes. Recheck current disclosures when distribution policies, expenses or prospectuses change. No payout, capital value or withdrawal rate is guaranteed here.




Comments