

An S&P 500 chart can recover while a household's plan remains damaged. The index does not pay tuition, replace lost wages or sell shares to cover retirement spending. An investor may have to do all three.
The practical question is not simply whether U.S. stocks have recovered from past crashes. It is whether you can meet your spending commitments while waiting for a recovery whose timing you do not know. This article separates the market's recovery, your account balance and your ability to pay bills.
S&P 500 crashes: calendar losses are not peak-to-trough losses
The S&P 500 is a large-company U.S. equity benchmark, not a capital guarantee. A calendar-year return measures one year-end against the previous year-end. A drawdown measures a fall from an earlier high. Those numbers answer different questions.
For a concrete historical example, First Trust's April 2009 market review records the S&P 500's 2008 total return at approximately −37%. That is a calendar-year figure, including income; it is not the full decline from the pre-crisis high to the eventual low.
A market can finish a year above its January level after suffering a severe decline during the year. A retirement plan must cope with the path inside the year, not just the number printed in the December factsheet.
A 50% loss needs a 100% gain to recover
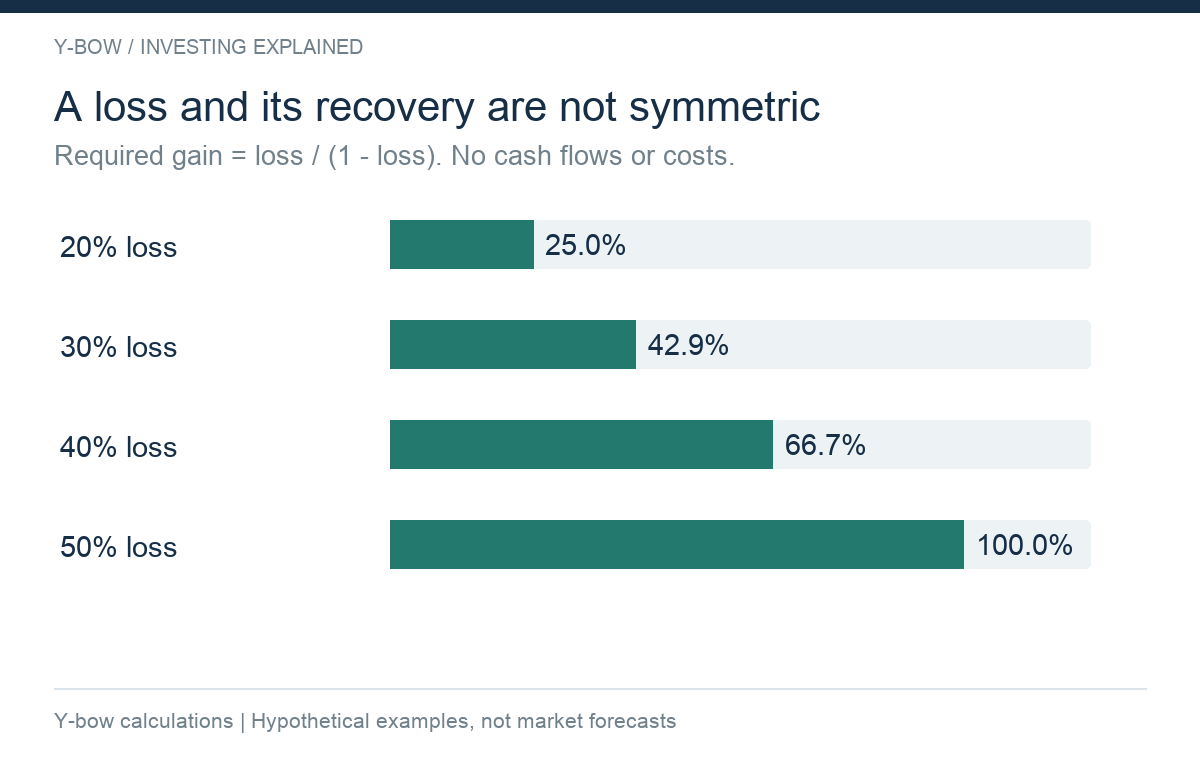
If a portfolio falls from 100 to 50, a 50% gain takes it only to 75. Recovering to 100 requires doubling the remaining 50. In general, the gain needed after a loss of d is d ÷ (1 − d).
| Decline from starting value | Remaining from 100 | Gain needed to regain 100 |
|---|---|---|
| 20% | 80 | 25% |
| 30% | 70 | 42.86% |
| 40% | 60 | 66.67% |
| 50% | 50 | 100% |
This arithmetic says nothing about how many years recovery will take. A portfolio may recover quickly, slowly or not before you need the money. Nor does it account for withdrawals, additional contributions, dividends, taxes or inflation.
Price recovery, total-return recovery and purchasing power
A price index excludes dividends. A total-return series incorporates them under a specified reinvestment convention. An investor who spends distributions does not have the same account path as a chart that reinvests everything.
The currency matters as well. A dollar S&P 500 chart is not the result for a household that will spend euros, pounds or yen. The local-currency return combines the investment return with the change in the value of a dollar in that currency. Inflation then changes what the ending balance can buy.
For example, if an investment ends a period at the same nominal value while consumer prices are 10% higher, its purchasing power is about 9.09% lower: 1 ÷ 1.10 − 1. Getting back to the old account balance is not the same as getting back to the old standard of living. This is a hypothetical illustration.
Regular contributions help buy units, not guarantee recovery
A fixed contribution buys more units when the price is lower. But it requires income and spare cash at the time the market is falling. Someone facing unemployment during a recession may not be able to keep buying.
Keep separate records of total deposits, withdrawals and investment value. An account reaching a new high because you deposited more money has not necessarily earned a positive return. Conversely, a negative market return does not tell you the return on every monthly contribution.
When comparing an accumulation backtest, specify the starting date, end date, contribution timing and currency. A single 20- or 30-year period does not prove every future period of that length will be profitable. Our return-measurement guide explains how to read those figures.
Retirement withdrawals change the recovery arithmetic
Consider an invented three-year return sequence: −20%, +25%, +10%. Without cash flows, 100 finishes at 110. Reversing the sequence gives the same final value because the same growth factors are multiplied together.
Now withdraw a fixed 4 at each year-end. In the decline-first sequence the balances are 76, 91 and 96.10. In the reverse sequence, +10%, +25%, −20%, the balances are 106, 128.50 and 98.80. The same returns produce a different ending balance because withdrawals occur along the way.
Neither path is S&P 500 history or a retirement forecast. The example isolates one mechanism: after an early loss, the same cash withdrawal consumes more of the remaining portfolio. The market's later recovery cannot restore shares already sold.
What the 4% rule does not promise
Four percent can mean at least two different things: an initial withdrawal subsequently adjusted for inflation, or 4% of the current balance every year. The second approach cuts cash income when the portfolio falls. The first can require selling a growing fraction of a depleted portfolio.
A withdrawal rule must also specify the investment mix, time horizon, spending flexibility and meaning of success. Finishing a study with some money left is not the same as preserving the starting principal or meeting every family's spending needs.
Do not carry a historical stock-and-bond study directly into a leveraged-equity plan. Its return path and loss exposure are different. Read the cash-flow treatment before accepting a backtest's headline success rate.
How to build a plan that can tolerate a crash
Start with annual essential spending, expected income from other sources and the difference the portfolio must fund. Then identify expenses that can be postponed and those that cannot. A cash reserve buys time only to the extent that it covers that difference.
For an illustration, essential spending of $30,000 and reliable outside income of $18,000 leave a $12,000 annual gap before taxes and unexpected costs. Cash of $24,000 covers two years of that stated gap, not two years of every possible expense. It is not a recommendation to hold that amount.
A reserve also has opportunity costs and inflation exposure. Review how it would be replenished. “Sell stocks only after they recover” is incomplete unless you can explain what happens if the cash runs out first.
Before trusting an S&P 500 crash backtest
| Check | Why it changes the answer |
|---|---|
| Price or total return? | Dividends alter the measured recovery |
| Nominal or inflation-adjusted? | A recovered balance may buy less |
| Which currency? | The spending currency can change the loss |
| Contributions or withdrawals? | Cash-flow timing changes the portfolio path |
| Start date and worst period? | An attractive average can hide a difficult beginning |
| Fees, taxes and cash allocation? | These reduce or change usable money |
The SPY issuer's performance notes distinguish fund returns, index returns and tax assumptions. Use the same care with any chart you use for your own planning.
Sources checked October 15, 2026. Tables and the figure are Y-bow calculations; hypothetical examples exclude tax and costs. For the concentrated-equity version of this problem, continue to Nasdaq-100 crash and withdrawal risk.










Comments