

Index buying can create a real buyer for Kioxia shares. It does not create a guaranteed return for someone buying ahead of that buyer.
The distinction matters when the headlines run into trillions of yen. How much stock must a fund acquire? When must its portfolio match the revised index? Who might supply the shares? Kioxia’s two-stage TOPIX free-float revision offers a useful way to work through those questions, including Toshiba’s sales and a stock split that can distort a casual share-count comparison.
This article develops Y-bow’s analysis using JPX notices, Toshiba’s filed change reports, daily market data and historical TOPIX research. The charts are our own. We distinguish an index rule, a disclosed transaction and an estimate built from assumptions.
Research cutoff: October 13, 2026, before the Tokyo close.Price and volume observations end on October 9. The revisions have not yet taken effect. The demand calculations below are scenarios, not confirmed fund orders or observations of completed rebalancing.
Kioxia’s TOPIX revision: effective dates and likely trading dates
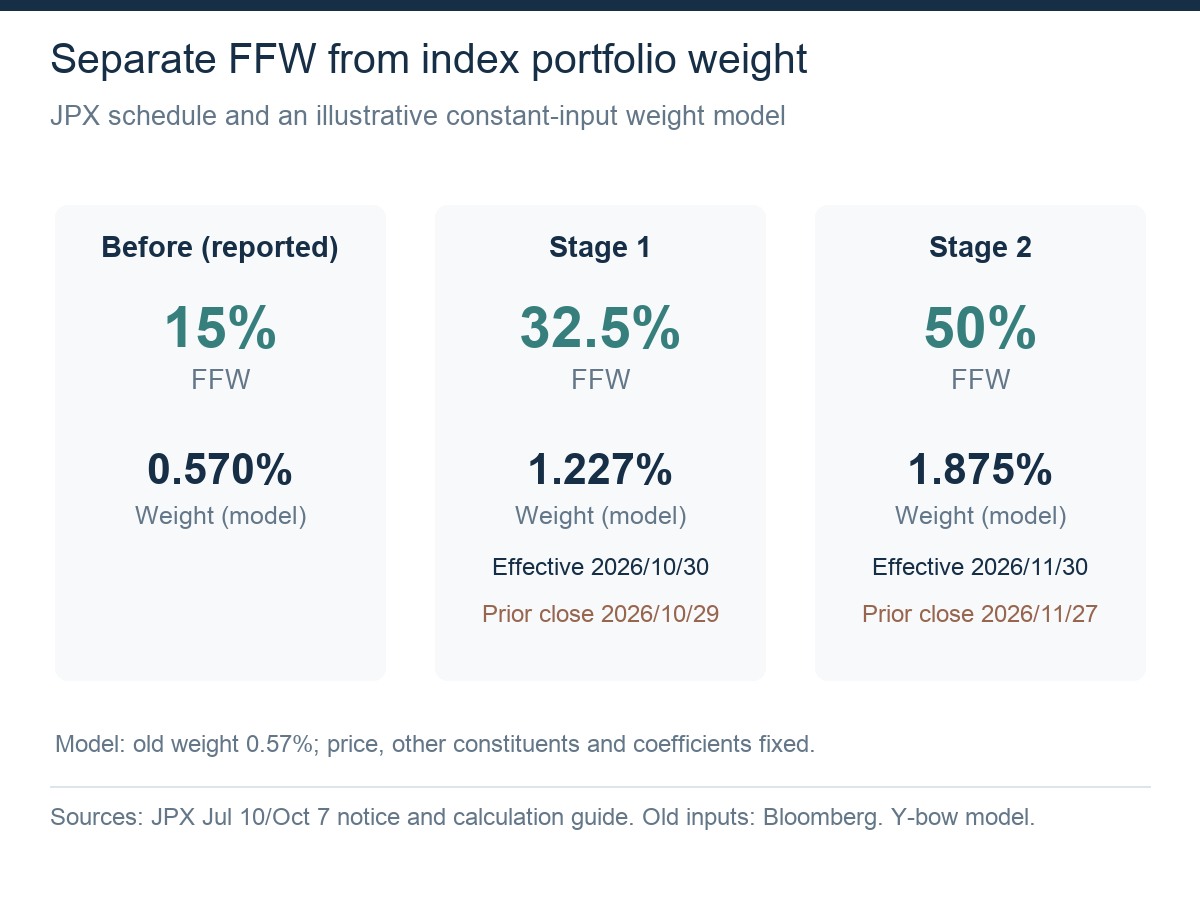
Free Float Weight rises in two steps, to 32.5% and 50%
JPX’s July 10 notice, updated October 7, specifies two stages for Kioxia Holdings, Tokyo ticker 285A. The announced FFW is 0.325 on the last business day of October and 0.5 on the last business day of November. JPX cites the need to moderate the effects on index-linked management and the market; corporate actions could still change the figures.
The old FFW of 15% and old index portfolio weight of 0.57% used in our model come from an October 7 Bloomberg report. They are a reported snapshot, not an independently downloaded current index master. A stock’s portfolio weight moves with its price and the rest of the index.
| Stage | Index effective date | Announced FFW | Previous trading-day close |
|---|---|---|---|
| 1 | Friday, October 30, 2026 | 32.5% | Thursday, October 29 |
| 2 | Monday, November 30, 2026 | 50% | Friday, November 27 |
The effective date is not necessarily the day of the fund’s purchase
JPX’s calculation guide, pages 7–8, uses the preceding business day’s price for an FFW change and adjusts the base market value after that close, before the effective day opens. A portfolio aligning with that transition therefore pays attention to the prior close. Treating “October month-end buying” as a promise of purchases at the October 30 close gets the sequence wrong.
That is an implication of the calculation timetable, not a verified order schedule for every manager. Advance purchases, execution across several sessions, derivatives and broker arrangements can alter the observable cash-market timing.
Why a higher free-float factor can create index demand
Free float is an index classification, not an order book
TOPIX weights companies by float-adjusted market capitalization. It asks how much stock is reasonably available for investment, rather than treating all issued shares as equally accessible. “Available” does not mean every holder intends to sell today. A long-term individual investor can still own shares counted in free float.
JPX’s FFW methodology estimates fixed ownership from public disclosures. Trust accounts, custodians and names holding shares for depositary-receipt issuance may have different treatment from strategic holders. Subtracting Toshiba’s ownership from 100%, or mechanically subtracting every top-ten holder, does not reproduce the official factor. The exchange’s listing-maintenance tradable-share ratio also has a different definition.
A fund’s target allocation changes; the company’s earnings do not
The underlying idea is price multiplied by index shares and an applicable float factor, with relevant caps and other coefficients included. Raising the factor increases the company’s indexed capitalization, other inputs held constant. A fund following TOPIX then needs a larger allocation to the stock.
The fund can finance that change by reducing other positions. It does not require new money entering the whole Japanese market. Nor does it increase Kioxia’s sales or operating profit. It changes ownership of existing equity.
Our memory-company buyback analysis explored the opposite direction: removing float can reduce benchmark holdings. Here, changes in previously fixed ownership may eventually increase index capacity. Following the shares makes both mechanisms easier to understand than labelling a headline simply bullish or bearish.
Calculating TOPIX demand without overstating it
The denominator changes too
Moving from 15% to 32.5% multiplies the factor by about 2.17; moving to 50% multiplies it by about 3.33. Neither number is a stock-price target. Even an index portfolio weight cannot simply be multiplied by that ratio, because the stock’s increase also expands the index’s total capitalization.
For a transparent model, hold prices, other constituents, index shares and additional coefficients constant. Let w₀ be the old portfolio weight and r the FFW ratio. Then new weight = w₀ × r / [1 + w₀ × (r − 1)]. Using w₀ = 0.0057 gives approximately 1.227% at the first stage and 1.875% at the second.
These are model outputs. October 2026 also brings a broader TOPIX review, so other companies’ factors, membership and transition coefficients will not necessarily remain fixed. A production estimate needs the full before-and-after index master at consistent prices. A 50% float factor does not mean Kioxia becomes half of TOPIX.
Use the second stage’s incremental change, not the whole change again
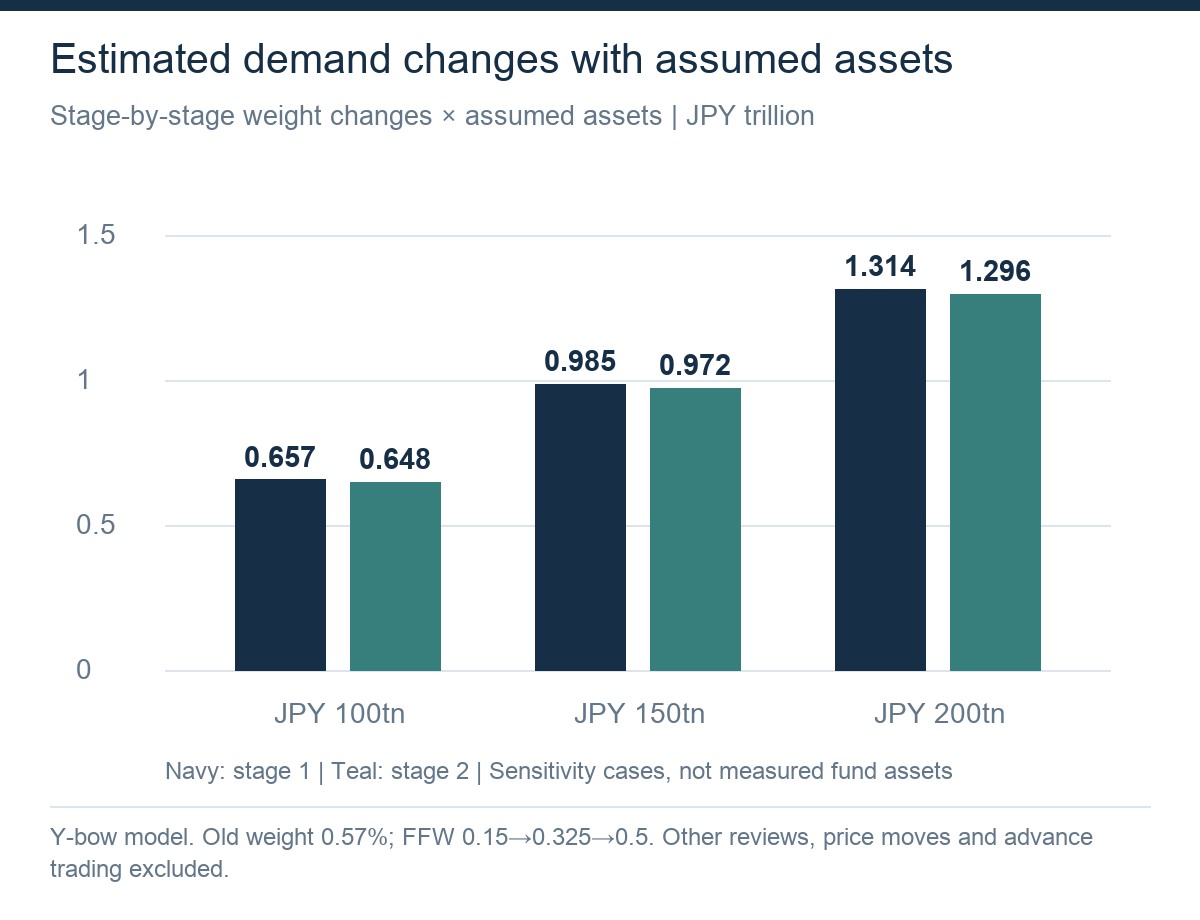
If tracking assets are A, a simple allocation estimate is A multiplied by the change in weight. At stage two, subtract the stage-one weight. Reusing the original weight at both stages double-counts the first increase.
| Assumed tracking assets | Stage 1 increase | Stage 2 additional increase | Total |
|---|---|---|---|
| JPY 100tn | JPY 0.657tn | JPY 0.648tn | JPY 1.305tn |
| JPY 150tn | JPY 0.985tn | JPY 0.972tn | JPY 1.958tn |
| JPY 200tn | JPY 1.314tn | JPY 1.296tn | JPY 2.610tn |
The Bloomberg report also quotes a brokerage estimate of about JPY 1.1tn per stage. Different valuation dates, asset definitions and full-index changes can explain different estimates. Choosing the largest number is less useful than explaining its inputs.
Assets benchmarked to TOPIX are not all passive funds buying cash shares at one close. Active portfolios, futures, swaps, pre-positioning and subscriptions or redemptions matter. Counting an ETF and separately counting every portfolio holding that ETF can also count the same exposure twice.
広告
Translate yen into shares, then compare with trading volume
A seven-session average of 39.21 million shares
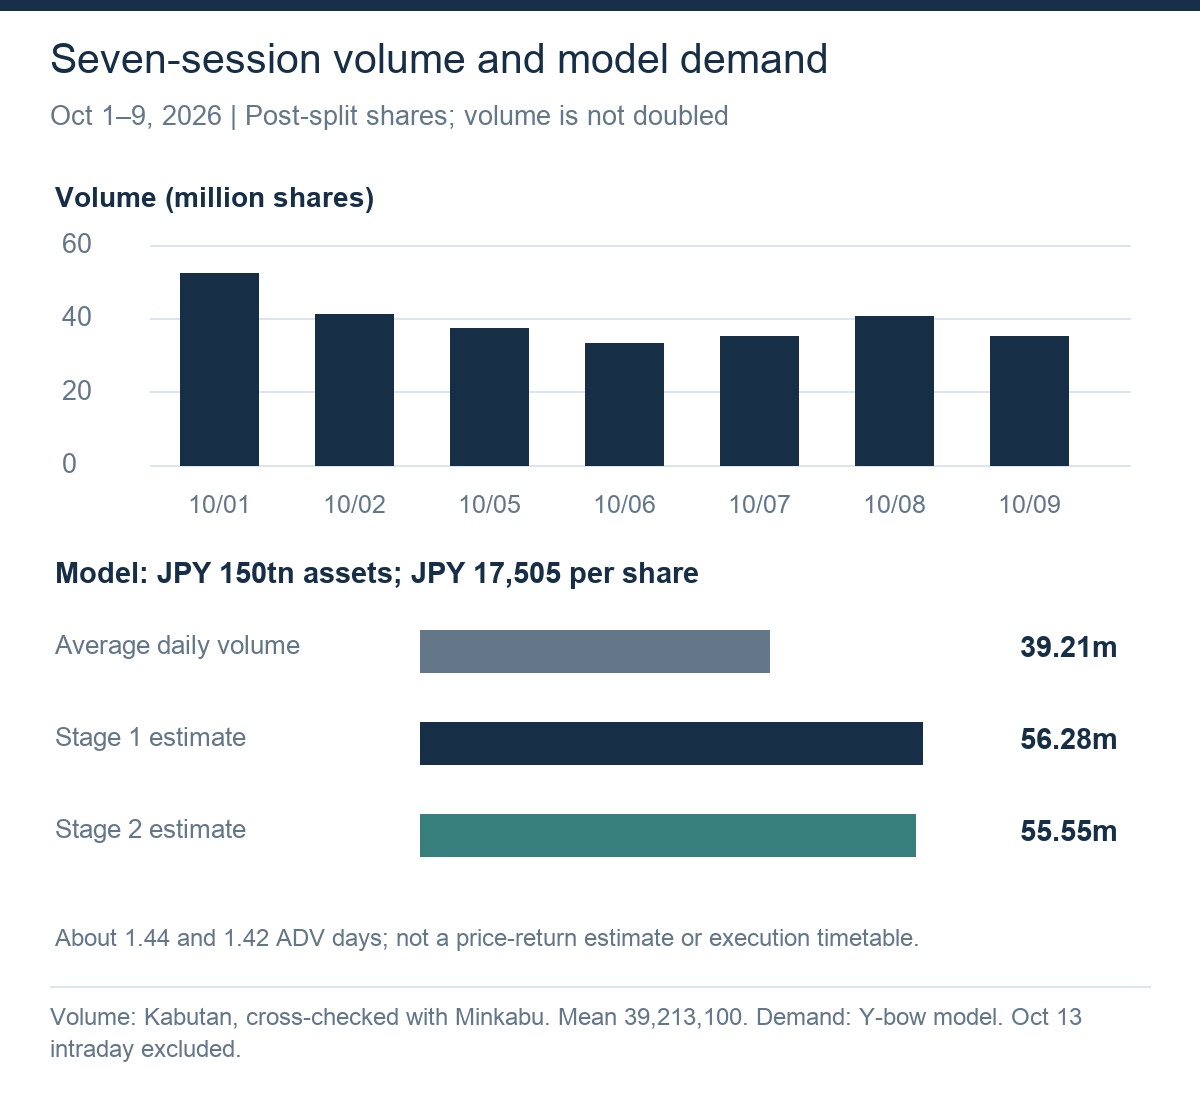
We checked Kabutan’s daily market data against Minkabu. Across the seven sessions from October 1 through October 9, volume ranged from approximately 33.12m to 52.34m shares, with a simple average of 39,213,100. All observations use post-split units. This short window is neither a 30-day average nor a forecast of future liquidity.
Dividing the JPY 150tn asset scenario by the October 9 close of JPY 17,505 gives about 56.28m shares for stage one and 55.55m for stage two: 1.44 and 1.42 average daily volumes. That scale is easier to evaluate than a trillion-yen headline alone.
ADV days are not a price-impact forecast
A transaction has a buyer and a seller; market volume should not be doubled to count both. The same stock can change hands repeatedly, so daily turnover is not a count of unique long-term owners offering their holdings.
Nor is full-day volume the supply available at the closing auction. A hypothetical buyer limiting participation to 10% of average volume would need about 14.4 sessions to acquire the stage-one estimate. That calculation illustrates an execution constraint. It does not describe an actual manager’s plan.
Concentration in time, seller willingness and inventory already assembled by arbitrageurs all matter. A large order can have little effect if ample sellers accept the prevailing price; a smaller order can move price sharply when liquidity is thin.
Price and target weight must also be kept consistent. After a price decline, a fixed cash amount buys more shares, but the company’s index weight falls too. Holding demand yen fixed while recalculating only shares can produce a misleading claim that falling prices automatically create much more index demand.
Toshiba’s sales: the supply side of Kioxia’s index story
Do not confuse a March shareholder table with October ownership
Kioxia’s shareholder page gives Toshiba’s 17.59% interest as of March 31, 2026. A recently accessed page is not necessarily a recently measured holding.
Toshiba’s Change Report No.21, filed October 8, reports 194,193,100 shares and 11.80% as of October 1. This is the latest filing verified for this analysis, not real-time ownership on October 13. The linked PDF is a redistribution of the original EDINET filing.
Normalize the split before adding sale quantities
The filing records intermittent market sales, not an equal daily schedule. Kioxia’s three-for-one split notice specifies an October 1 legal effective date, but trade quantities change across the ex-date. Multiplying every sale before October 1 by three would incorrectly adjust the September 29 quantity.
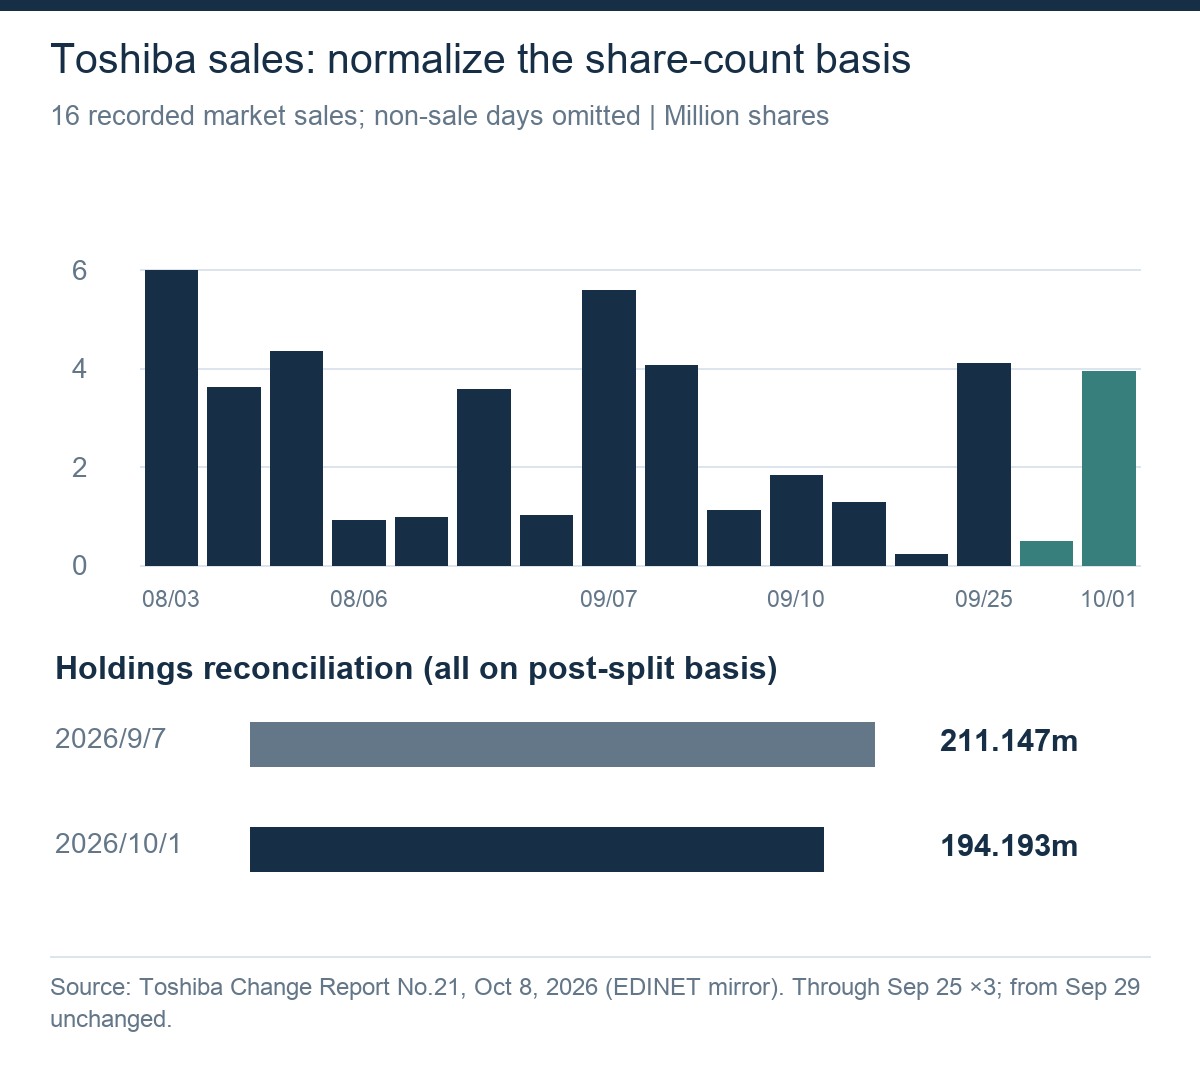
The reconstruction can be checked against the holdings. No.20 reports 70,382,300 shares on September 7. Multiply by three, then subtract 16,953,800 normalized shares sold from September 8 through October 1: the result is exactly 194,193,100. The filing’s split addition also reconciles with two additional shares per pre-split share.
This check guards against mixing units or counting overlapping 60-day disclosures twice. It establishes historical sales. It does not establish a future liquidation timetable or a plan to sell into the index event.
Past selling can lead to later index demand
A strategic holder releasing stock supplies the market now. When the changed ownership structure is recognized in an index, it may create demand later. The same ownership transition can therefore support a selling-pressure narrative at one point and an index-buying narrative at another.
Those flows cannot simply be subtracted as if they were simultaneous. A completed September sale is not an October order still waiting to hit the market. Remaining holdings are potential supply, not committed sales. Nor does the latest Toshiba filing mean every subsequent sale is automatically included in the already announced 50% November factor.
広告
Historical evidence: anticipation matters, guarantees do not
The October 2006 TOPIX revision
An April 2007 NLI Research Institute study examined the October 2006 FFW review. The increasing-weight group outperformed the decreasing-weight group relatively as month-end approached. The report compared an index-matching model with one moving toward the revised allocation in advance.
| Study model | Excess return versus TOPIX | Estimated ex-ante tracking error |
|---|---|---|
| Full replication | 2.6 basis points | 0.0 basis points |
| Advance allocation | 14.2 basis points | 17.0 basis points |
One basis point is 0.01%. These are results for that study’s period and assumptions. Advance positioning also took benchmark-deviation risk. The evidence supports asking how much demand is anticipated, not assuming the same result for Kioxia.
Official implementation can differ from an investor’s float estimate
In a different example, JPX retained GMO Internet’s existing factor in July 2025 after considering a post-year-end business transfer and shareholder distribution. This does not predict cancellation of Kioxia’s announced revision. It shows why a shareholder-table calculation cannot replace the official implementation notice.
Kioxia’s October 8 close was unchanged
In our current sample, Kioxia closed at JPY 17,900 on both October 7 and October 8, then JPY 17,505 on October 9. A favorable intraday reaction need not survive to the close.
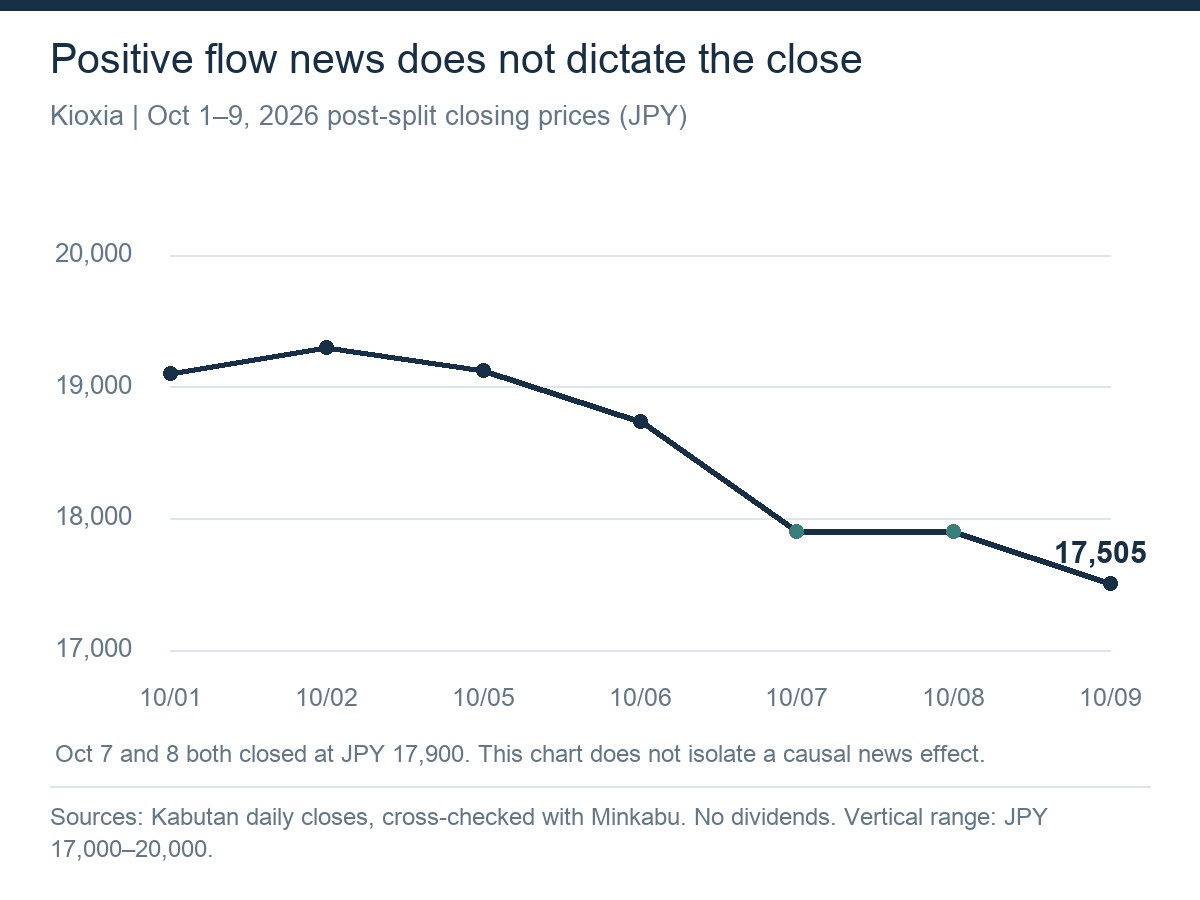
That does not prove index buying is irrelevant. Earnings expectations, NAND pricing, currencies, the broader market, leveraged positions and existing-holder sales operate together. A better evaluation separates the announcement window, execution window and subsequent 1-, 5- and 20-session returns. Comparison with TOPIX and relevant semiconductor stocks helps, but a simple market-adjusted return is not a causal estimate.
The U.S. ADS plan is separate from TOPIX rebalancing
Kioxia’s May 15 announcement describes preparations to list American depositary shares on a U.S. stock exchange. The venue, timing and method remained undecided. Its September 15 response to media reports repeated that distinction. Preparation is not regulatory approval or a fixed offering schedule.
Separately, Citi’s depositary information lists an OTC ADR under KXIAY. An existing OTC program is not the company’s proposed exchange listing. ADS denotes the depositary-share unit; ADR denotes the receipt representing it, although everyday usage often groups them together.
Investors comparing Tokyo shares with depositary receipts must align the current ratio, foreign exchange, trading hours, liquidity, fees and corporate-action handling. Issuance or cancellation availability can also matter. One Tokyo share and one receipt are not automatically equivalent units.
Depositing existing shares is not necessarily new equity issuance. An offering with newly issued shares would introduce financing and dilution questions. Index eligibility and float treatment then depend on the actual structure and each provider’s rules. A U.S. listing does not automatically trigger inclusion in every U.S. index.
What to check after both stages
- Official terms: verify the factors, effective dates, index shares and any revised coefficients.
- Actual weights: include the whole index review, rather than our constant-input model alone.
- Supply: date the latest holder disclosure, normalize splits and eliminate overlapping transactions.
- Execution liquidity: distinguish full-day turnover from available supply around the close.
- Persistence: separate a one-time allocation change from continuing subscriptions to index funds.
- Business value: revisit NAND prices, shipments, mix, capital spending and earnings assumptions.
Kioxia’s IR calendar also schedules second-quarter results for October 30 at 18:45 Japan time, according to the IR news page; the timetable should be reconfirmed. Closely spaced index and earnings events make subsequent price attribution particularly difficult.
広告
Frequently asked questions about Kioxia’s index flows
Does a 3.33-fold FFW increase mean a 3.33-fold price increase?
No. It is a factor ratio. Portfolio weights have a changing denominator, and price impact depends on supply, expectations and execution. There is no mechanical conversion from that ratio to a return.
Does JPY 1tn of buying add JPY 1tn to market capitalization?
No. Market capitalization applies a quoted price to shares outstanding. Transaction value measures traded shares at execution prices. Their changes are not interchangeable.
Will Toshiba’s remaining stake cancel out all index buying?
A holding is not a sell order. Without a confirmed quantity and schedule, the entire stake cannot be treated as simultaneous supply. Completed sales cannot be deducted again from future demand.
Can a broad semiconductor ETF reproduce this event?
Only actual portfolio holdings determine exposure. Listing markets and constituent universes differ. A sector label alone does not make an ETF a direct instrument for Kioxia’s TOPIX revision, and leverage adds separate path-dependent risks.
Y-bow’s view: focus on timing and supply, not the largest headline
The useful sequence is ownership change, index recognition and portfolio adjustment. Because that sequence is announced in advance, investors other than passive managers can position before the required allocation change. The order flow may be real while its opportunity is already partly priced.
Splitting implementation reduces the adjustment required at one time. It does not promise two equal rallies. Supply assembled before the first stage, positioning unwound afterward and earnings released between stages can change the environment for the second.
The question is therefore not just whether a buyer has a reason to buy. It is how much must still be acquired, when, and from whom at the prevailing price. Calculating demand answers only part of that question.
This framework remains useful after Kioxia’s event: verify the notice, denominator, assets, units, liquidity, sellers and timing. For the operating cycle behind the stock, read our semiconductor-supercycle analysis. For capital allocation and the opposite float mechanism, see our SK hynix, Micron and Samsung buyback comparison.
Charts and model calculations by Y-bow. Disclosures checked October 13, 2026; market observations through October 9. This is educational analysis, not a recommendation or a guarantee of an index-event profit. Estimates should later be compared with observed implementation outcomes.



Comments