
An 800 VDC data-center design changes how electrical power travels toward a rack. The GPUs still need much lower supply voltages at their boards. The comparison is about where conversions take place, how far higher-voltage distribution extends and which equipment supplies or protects each segment.
The Open Compute Project describes work involving Google, Microsoft and NVIDIA on low-voltage DC distribution, and NVIDIA has published an 800 VDC architecture. A proposed specification, a demonstration and a production deployment have different evidentiary weight. Look for the stage the announcement actually documents.
Trace the path from facility power to the GPU
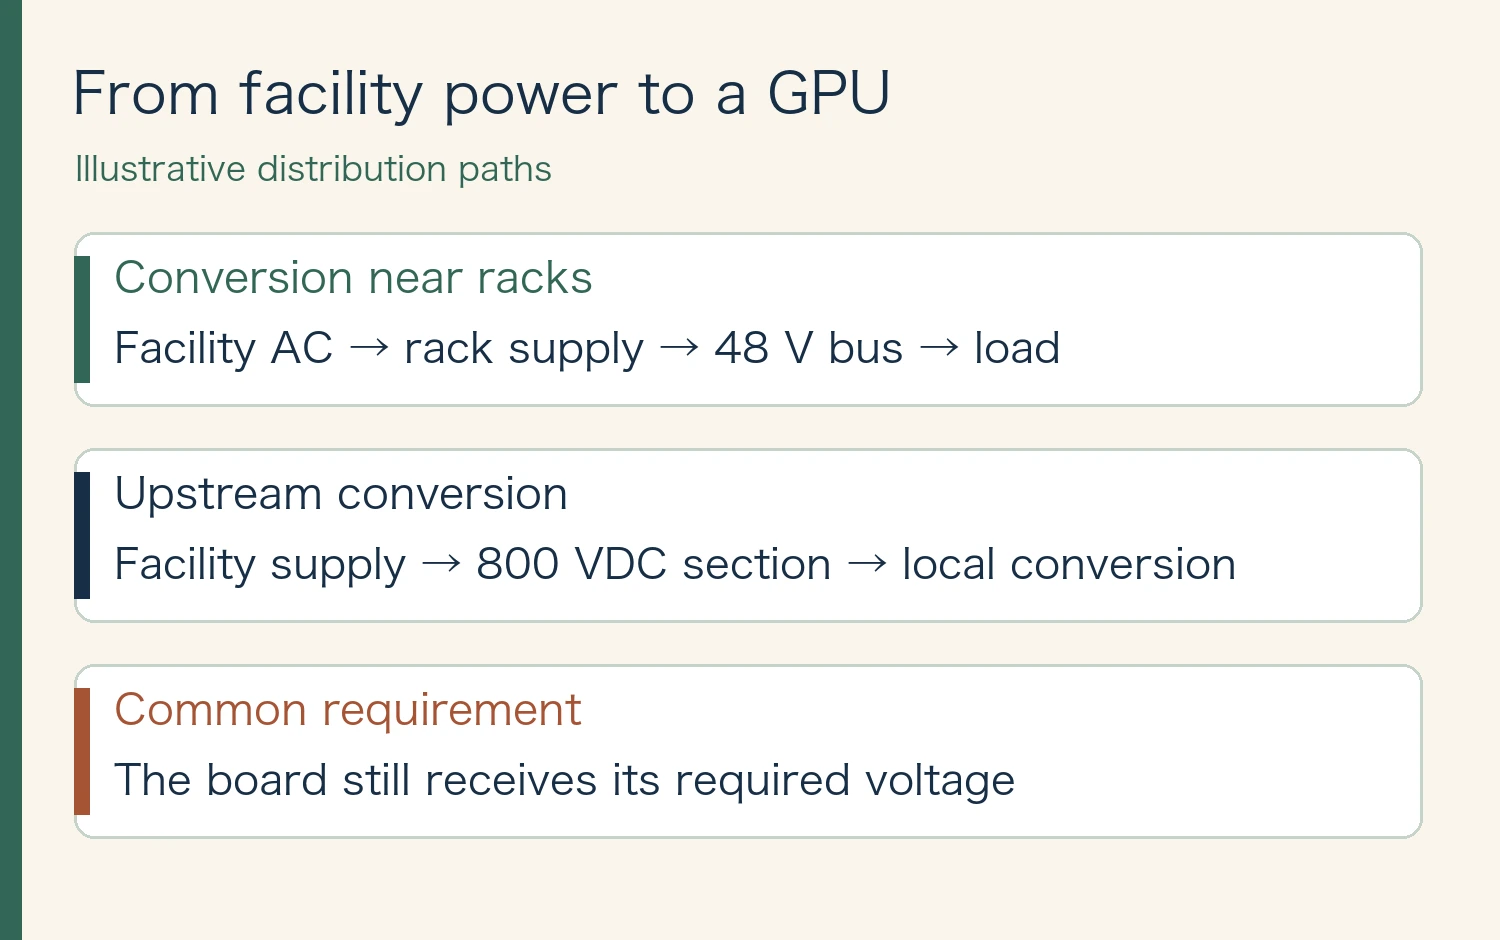
A rack may receive AC and convert it near the equipment before distributing lower-voltage DC, such as a 48 V bus. In an 800 VDC architecture, some conversion moves upstream, with a higher DC voltage carrying power closer to the rack. Downstream conversion still supplies the voltages used by boards and components.
Backup power and protection can sit at different points in different designs. Use the diagram as a comparison of paths. It does not imply that every existing facility distributes 48 V across the building or that every 800 VDC proposal uses the same set of components.
Advertisement
What happens to current at the same power?
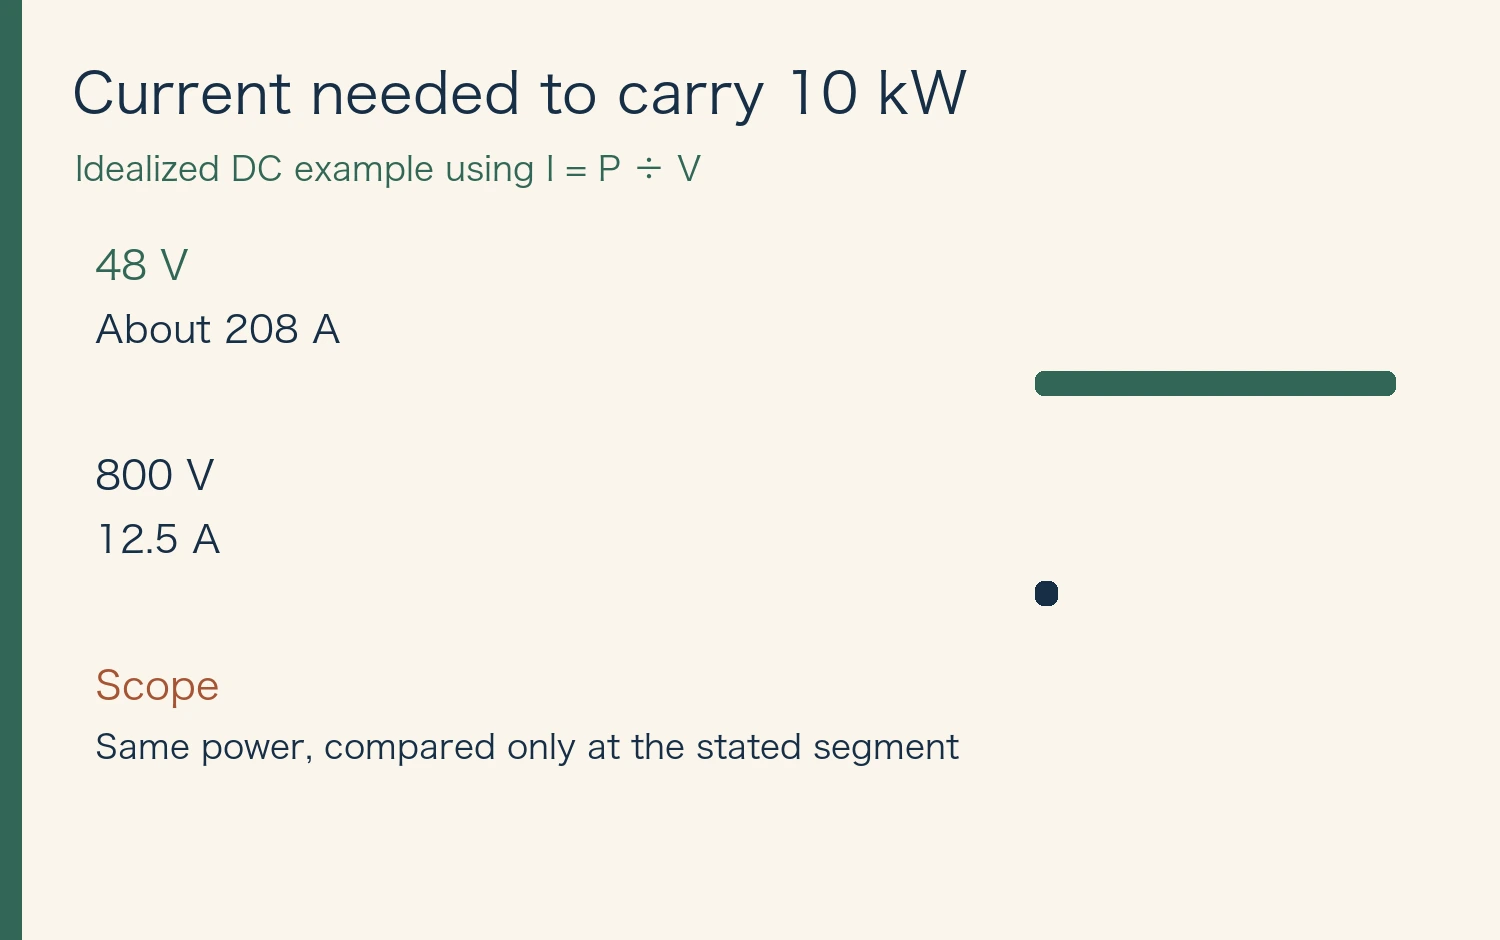
For a simplified DC example, power equals voltage times current. Ten kilowatts at 48 V corresponds to about 208 A. At 800 V the same power corresponds to 12.5 A. The current in the compared segment is about 16.7 times lower.
Resistive heating is proportional to current squared when resistance is held constant. Actual conductors, run lengths, junctions and temperature vary, and conversion stages introduce their own losses. The current calculation therefore says nothing by itself about the percentage change in a facility’s electricity bill.
Ask what the efficiency figure includes
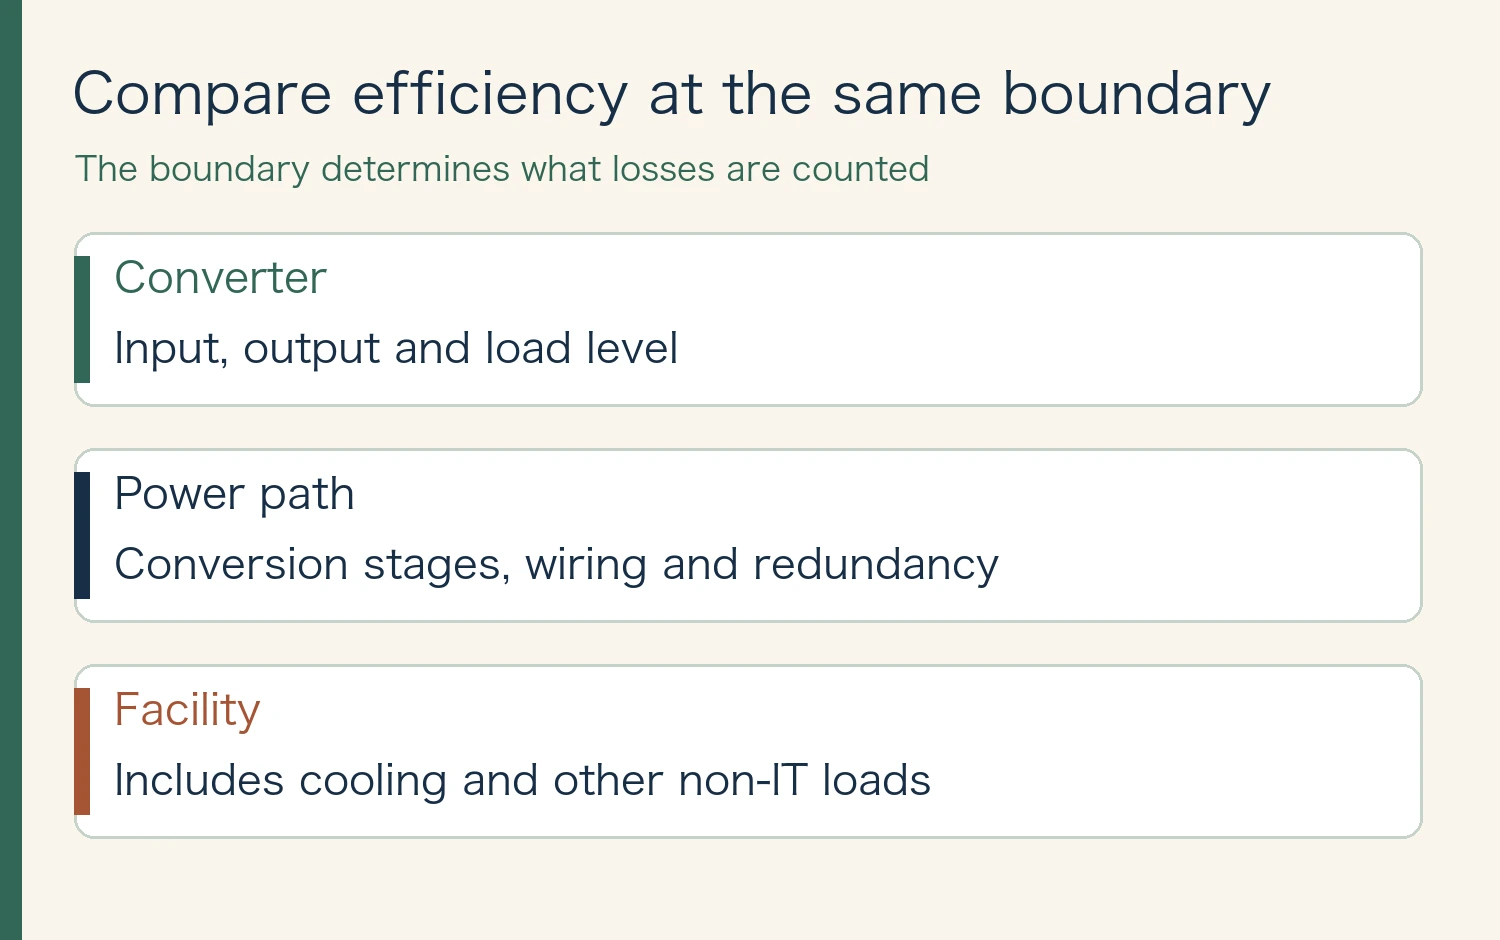
Compare input and output at the same boundaries, load levels and redundancy settings. A converter efficiency figure covers a different system boundary from facility power usage effectiveness, which includes non-IT energy. Changing the number or location of stages makes each stage and the overall boundary worth checking separately.
At higher DC voltage, insulation, protection, isolation during service and interruption of DC faults are design constraints. Retrofitting adds questions about compatibility and the scope of failures. Look for documentation of how those issues were handled, along with the measurement of conversion losses.
← Swipe to view the full table →
| Item | What to verify |
|---|---|
| Converter | Input, output and load level |
| Power path | Conversion stages, wiring and redundancy |
| Facility | Includes cooling and other non-IT loads |
Advertisement
Read the next deployment announcement in four steps
Record rack power, which segments use DC, where efficiency is measured, and whether the system is a specification, a trial or a deployed design. Also distinguish a new build from a retrofit. Those details make two announcements comparable even if their headline voltage is the same.
Does 800 VDC reduce how much power a GPU uses?
GPU power at a fixed workload and the power lost while supplying it are separate measurements. To compare distribution efficiency, hold the workload constant and measure input power over the same delivery boundary.
Related reading: AI data center power demand
Sources and review date
Sources reviewed November 12, 2026. Figures and the cover were created for this article. Dated disclosures and illustrative examples are labeled in the figures.







Comments