

Micron reports a larger inventory balance. Is that an early warning that memory chips are piling up unsold—or a consequence of producing more complex products? The balance alone cannot settle the question. Inventory includes raw materials, work in process and finished goods, not just chips waiting for a customer.
This guide uses Micron Technology (MU) to build a repeatable earnings-reading process. Here, “inventory” means the company’s operating inventory, not shares held by investors or shares available to borrow. Official documents were checked on November 5, 2026. Reported figures, management commentary and our hypothetical examples are labeled separately; this is not a price target or a trading signal.
What is included in Micron inventory?
Raw materials are inputs into production. Work in process, or WIP, is value accumulated in products still being manufactured. Finished goods have completed production. The distinctions matter because a rise concentrated in unfinished production is a different observation from an accumulation of finished products.
← Swipe to view the full table →
| Component | What it represents | What the balance cannot establish |
|---|---|---|
| Raw materials and supplies | Inputs used in manufacturing | That future customer orders are certain |
| Work in process | Products moving through production | Whether units, processing time or costs increased |
| Finished goods | Completed products | Their expected sale dates and realizable prices |
Inventory dollars are not a unit count. A more expensive production process, a different product mix or a different stage of completion can change the balance even without an equal change in units. An inventory write-down can reduce the reported amount without physically removing a chip. This is why “inventory up 20%” and “20% more unsold chips” are different claims.
A real example: total inventory rose while finished goods fell
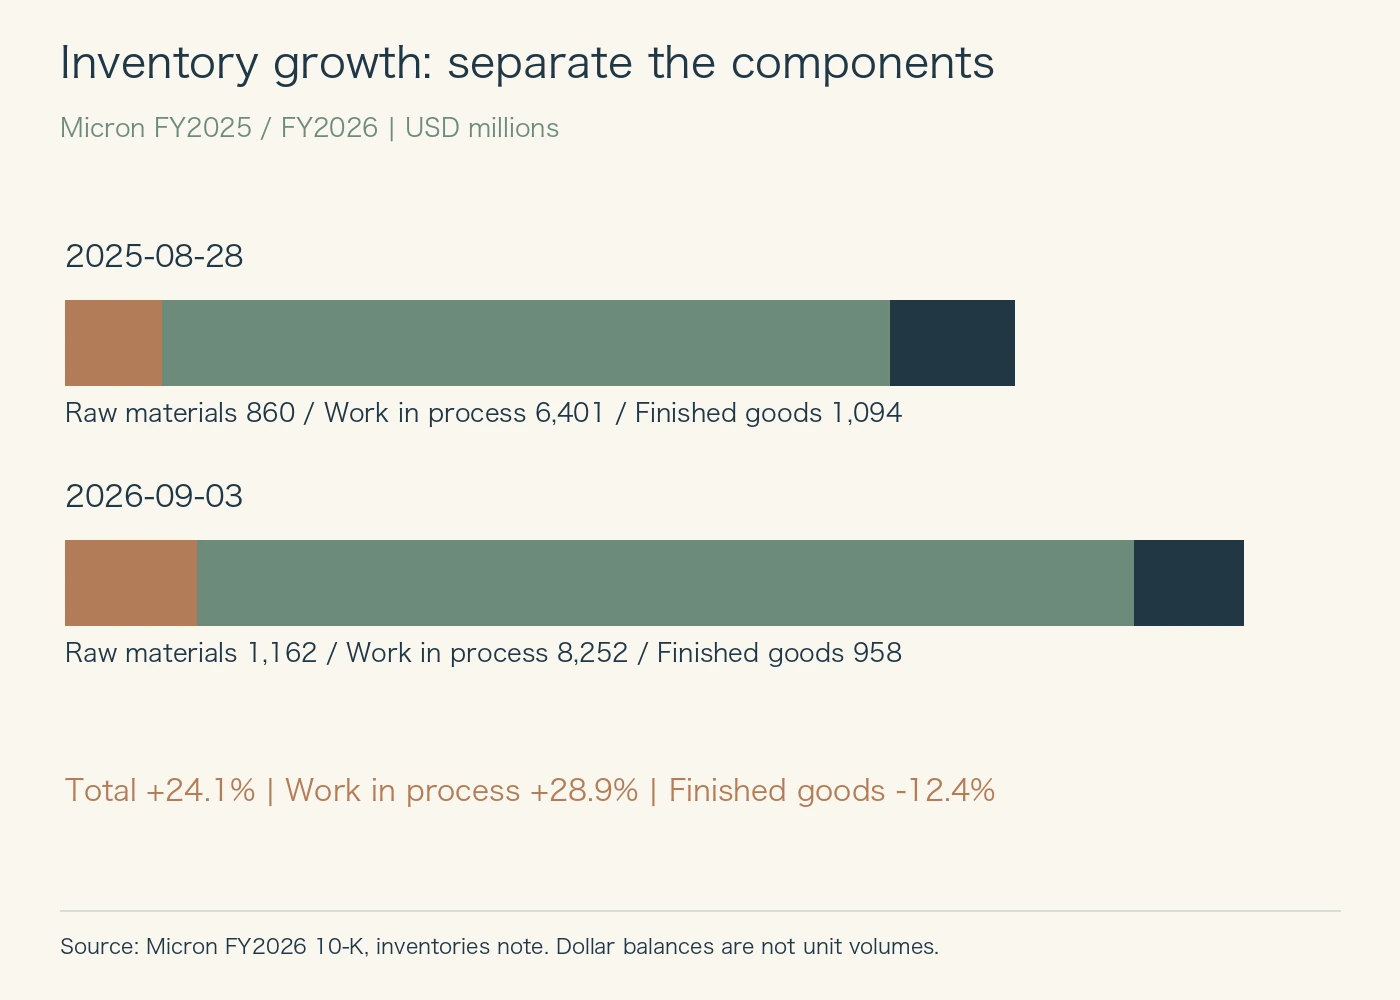
The FY 2026 Form 10-K reports total inventory of $10,372 million versus $8,355 million a year earlier, an increase of about 24.1%. WIP increased from $6,401 million to $8,252 million, while finished goods declined from $1,094 million to $958 million.
The narrow conclusion is useful: growth in the total was not the same as growth in finished goods. It does not prove that all WIP will sell promptly, that yields are improving, or that tight supply will persist. Production starts, processing time, transitions and cost changes still need investigation.
Nor can this table establish HBM inventory. It does not disclose a separate HBM balance. Allocating company inventory to HBM using a revenue percentage would manufacture precision from information that is not provided. Keep “HBM is important to the business” separate from “this is how much HBM inventory the company holds.”
Advertisement
Inventory days use cost of goods sold, not revenue
A standard analytical estimate is average inventory divided by cost of goods sold for the same period, multiplied by the number of days in that period. DIO means days inventory outstanding. When only beginning and ending balances are available, their simple average is an approximation to the average inventory actually carried.
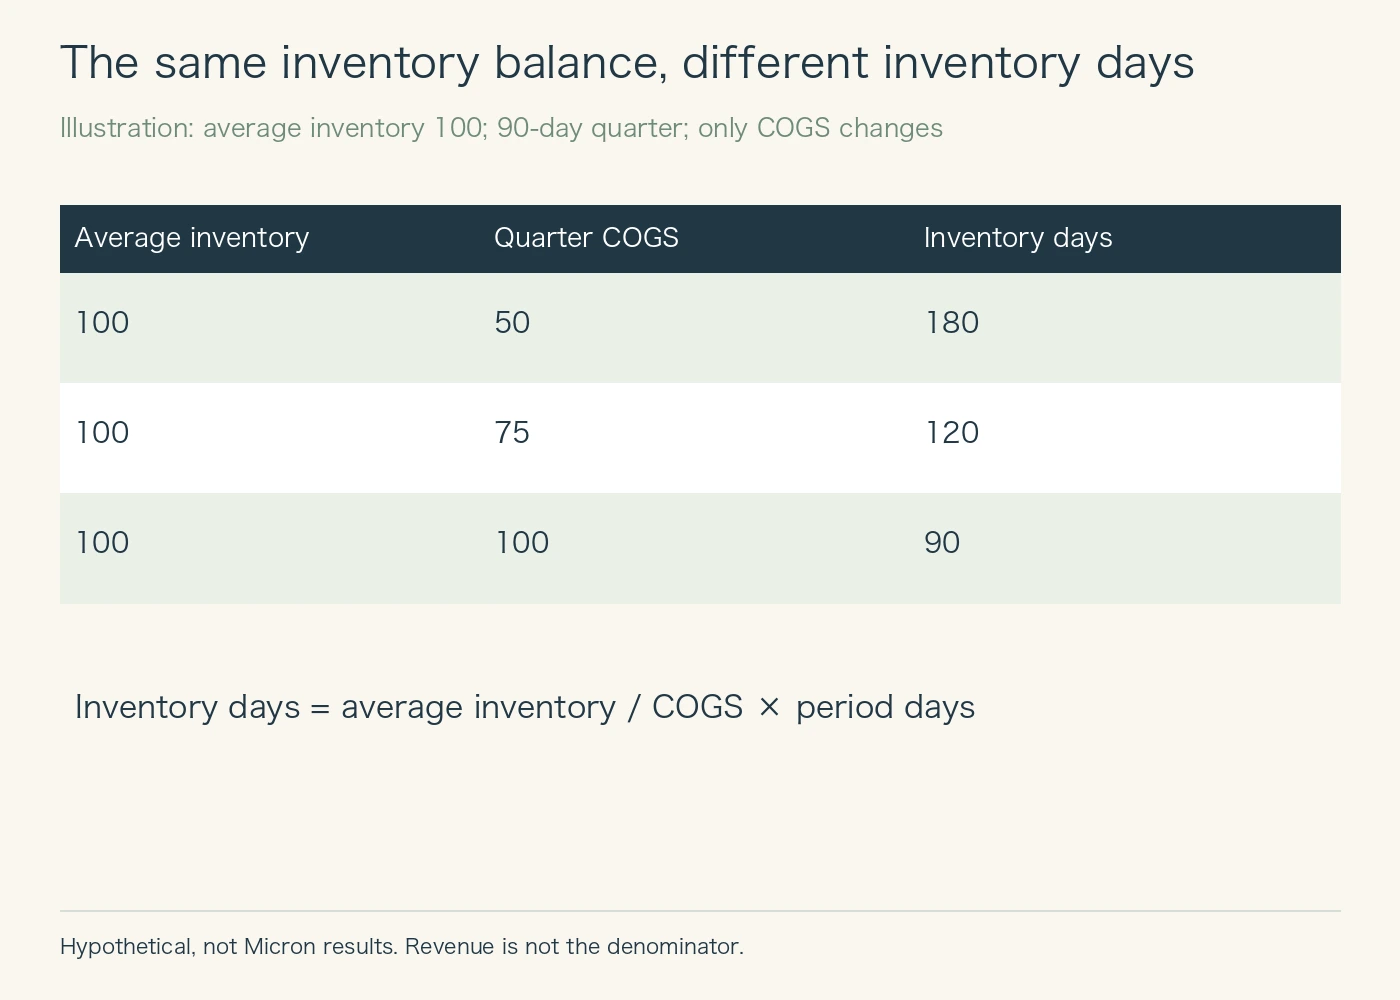
Hold average inventory at 100. If quarterly COGS is 50 over 90 days, estimated DIO is 180 days. At COGS of 75 it is 120 days; at 100 it is 90 days. Nothing changed in the inventory numerator. A rising ratio therefore does not identify a single cause: both the numerator and denominator deserve attention.
Revenue is measured at selling prices, while inventory is carried on a cost-related basis. Rising memory selling prices can make inventory as a percentage of revenue decline even when the operating stock is unchanged. That ratio can be informative, but it should not be spliced into a COGS-based DIO series. Preserve the formula along with the result.
Reported quarterly DIO and an annual estimate are not interchangeable
Micron’s Q 4 FY 2026 prepared remarks report ending inventory of about $10.4 billion and DIO of 129, nine days above the preceding quarter. Management attributed part of the increase to build-ahead for manufacturing-node end of life and manufacturing incentive compensation absorbed into inventory. Those are management explanations to monitor in later results.
For a separate, transparent annual calculation, use FY 2026 GAAP COGS of $25,684 million, beginning/ending average inventory of $9,363.5 million and 53 weeks, or 371 days. 9,363.5 / 25,684 × 371 = approximately 135.3 days. This is our annual approximation; it is not a reconstruction of the company’s quarterly 129-day metric.
← Swipe to view the full table →
| Question | Company figure | Our independent estimate |
|---|---|---|
| Period | FY 2026 fourth-quarter discussion | Full FY 2026 |
| Result | 129 days | About 135.3 days |
| Inventory convention | Use the company metric definition | Average of beginning and ending balances |
| COGS / day count | Check the disclosed calculation basis | Annual GAAP COGS / 371 days |
| Purpose | Follow a consistently defined company series | Demonstrate the calculation |
If two numbers disagree, first check annual versus quarterly periods, ending versus average balances, GAAP versus adjusted costs and the day count. A mismatch is not evidence of an error until the definitions match. Beginning/ending averaging also misses movements inside the year. Monthly averages could produce a different estimate.
FY 2026 had 53 weeks, compared with 52 in the preceding year. Do not silently impose 365 days on every annual period or 90 days on every quarter. For a time series, choose a consistent convention and disclose any deviation. A smaller but comparable series is more informative than a longer chart mixing incompatible measures.
Connect inventory to margins, receivables and cash
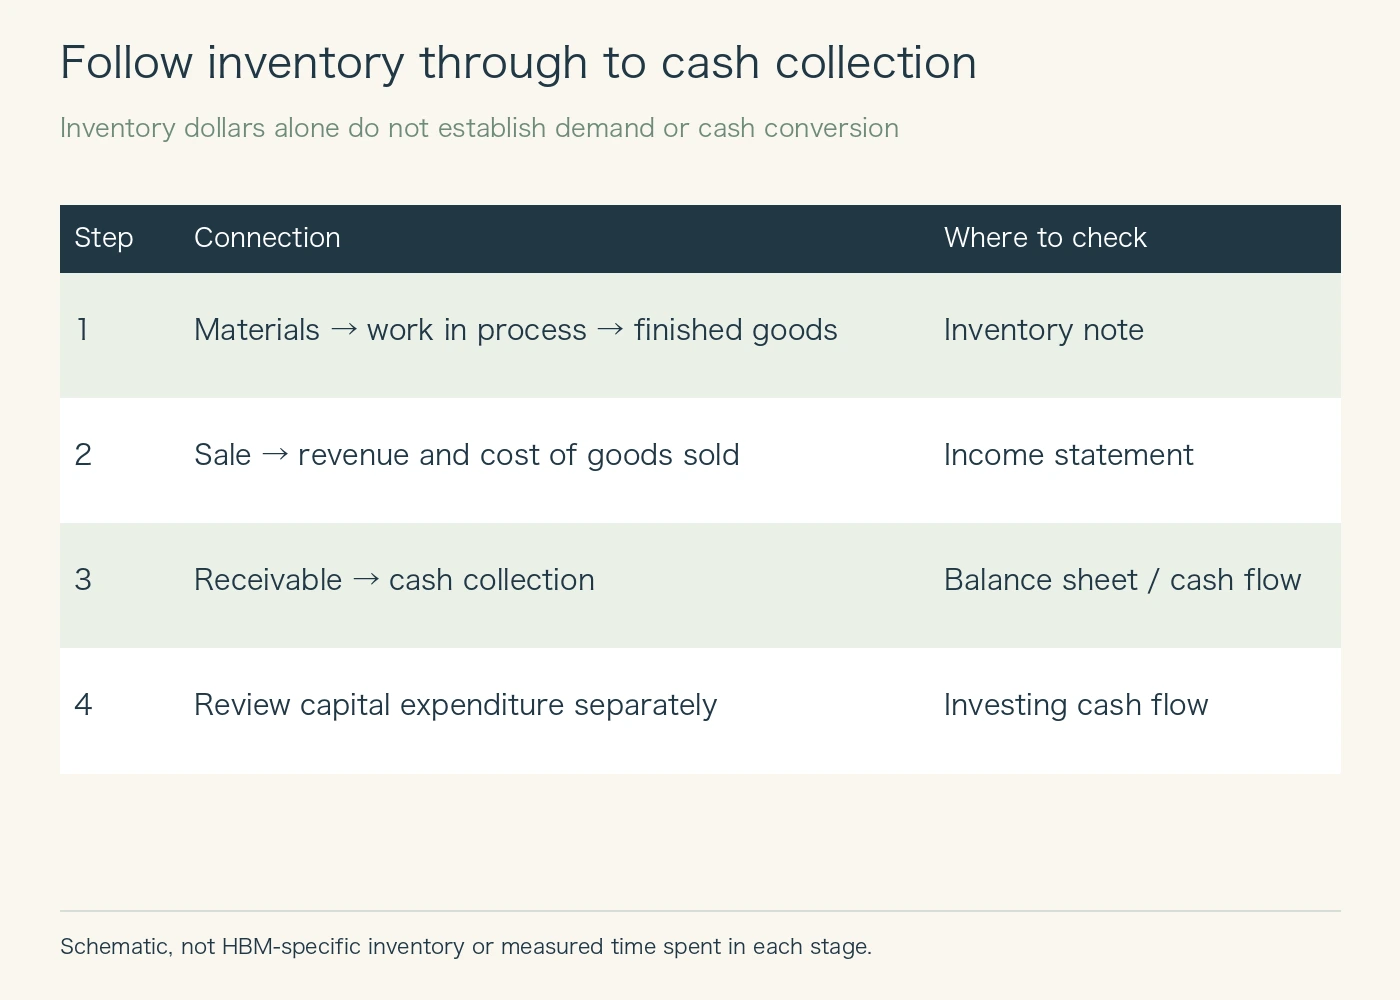
A sale generally moves the corresponding inventory cost into COGS. If payment follows later, recognized revenue leaves a receivable rather than immediate cash. Inventory can decline and revenue can increase while cash collection still lags. The three statements answer different questions about the same operating process.
Accounts payable matter too. Delaying supplier payments can support operating cash flow even when inventory is growing. Instead of reading one cash-flow total as a verdict, inspect the contributions from inventory, receivables and payables. Balance-sheet changes and cash-flow adjustments may differ because of noncash items or other reconciliation effects; do not force them to match without evidence.
Factory and equipment spending belongs to a separate investment decision. Strong operating cash flow can coexist with a much smaller amount left after capital expenditure. Equating the increase in inventory with the period’s cash spending—or with the decline in free cash flow—skips those distinctions.
Related book (affiliate advertisement)
Related reading on financial statements, working capital, and the distinction between profit and cash. This is not presented as a book recommending Micron shares.
Financial Intelligence, Revised Edition (English hardcover)
View this edition on Amazon Japan
Check the linked page for price and availability. As an Amazon Associate, Y-bow earns from qualifying purchases.
Advertisement
A worksheet for the next Micron earnings release
← Swipe to view the full table →
| Observation | Cross-check | Do not yet conclude |
|---|---|---|
| Inventory increased | WIP, finished goods and materials | All of it is unsold finished product |
| DIO increased | COGS, period length and methodology | Weaker demand is the only cause |
| Gross margin weakened | Pricing, mix, costs and write-downs | Inventory explains the entire move |
| Operating cash flow weakened | Receivables, payables and inventory effects | Accounting profit is necessarily unreliable |
| Management expects improvement | Later actual results and revised explanations | The improvement is already achieved |
A useful research note might read: “Total inventory increased; WIP drove the change; reported costs included a specific factor; next quarter’s margin and inventory conversion need checking.” That is more testable than “inventory is bad.” It identifies what evidence would strengthen or weaken the interpretation.
An example of a combination warranting closer scrutiny would be persistent finished-goods growth alongside weaker selling prices, write-downs and deteriorating cash conversion. This is a general investigation framework, not a claim that all those conditions currently apply to Micron. Avoid treating a single DIO threshold as universally healthy or unhealthy across different manufacturing models.
Questions investors often ask
Is lower inventory always better?
No. It can reflect efficiency, but insufficient stock can also limit deliveries. Inventory management, business profitability and the valuation investors place on future earnings are separate subjects. A DIO decline is not, by itself, a stock-price forecast.
Can total inventory tell me whether HBM demand is strong?
Not quantitatively on its own. Product-specific units, costs and inventory are needed for that attribution. State what is undisclosed instead of allocating company totals using an unrelated percentage.
What should I update first next quarter?
Record balances, consistently defined reported DIO, COGS and management’s explanation. Then compare actual outcomes with the prior explanation and outlook. Keep both records so the next narrative does not overwrite what was expected earlier.
Sources, related reading and update method
For the wider industry, see our HBM, DRAM and NAND company map, which separates memory technologies and the businesses supplying them.
For a broader earnings-reading example, see the author’s free Japanese-language note on Micron revenue, profit and cash. The language and subject are identified here so it is not mistaken for an English translation of this inventory guide.
Primary sources: Micron FY 2026 Form 10-K and Q 4 FY 2026 prepared remarks. Dollar balances use millions unless stated otherwise. Percentage changes and the annual DIO estimate are our calculations. We use comparable year-end components rather than inventing missing quarterly or HBM balances. Update the figures and definitions when new filings appear. The hero is an AI-generated conceptual illustration; the three explanatory figures are original, reproducible work.
This article provides general education, not personalized investment advice.







Comments